So, you’re looking for a business partner and you want to evaluate your prospect to determine if they are going to be a good fit. What metrics should you consider to make shrewd, data-driven partnership decisions?
Analyzing prospective partners’ website traffic is one way to gain a deeper understanding of their business. To start, enter the domain name of your prospect into the Traffic Analytics tool.
Look at the Total Quantity of Their Traffic
Visits and unique visits per month will give you an immediate barometer of this business’s reach. If the business is a SaaS, media outlet, or ecommerce, their overall website traffic is a reflection of their audience size.
Beginning with the Traffic Overview report, view the number of visits and unique visits. These figures represent our estimate for the previous month.
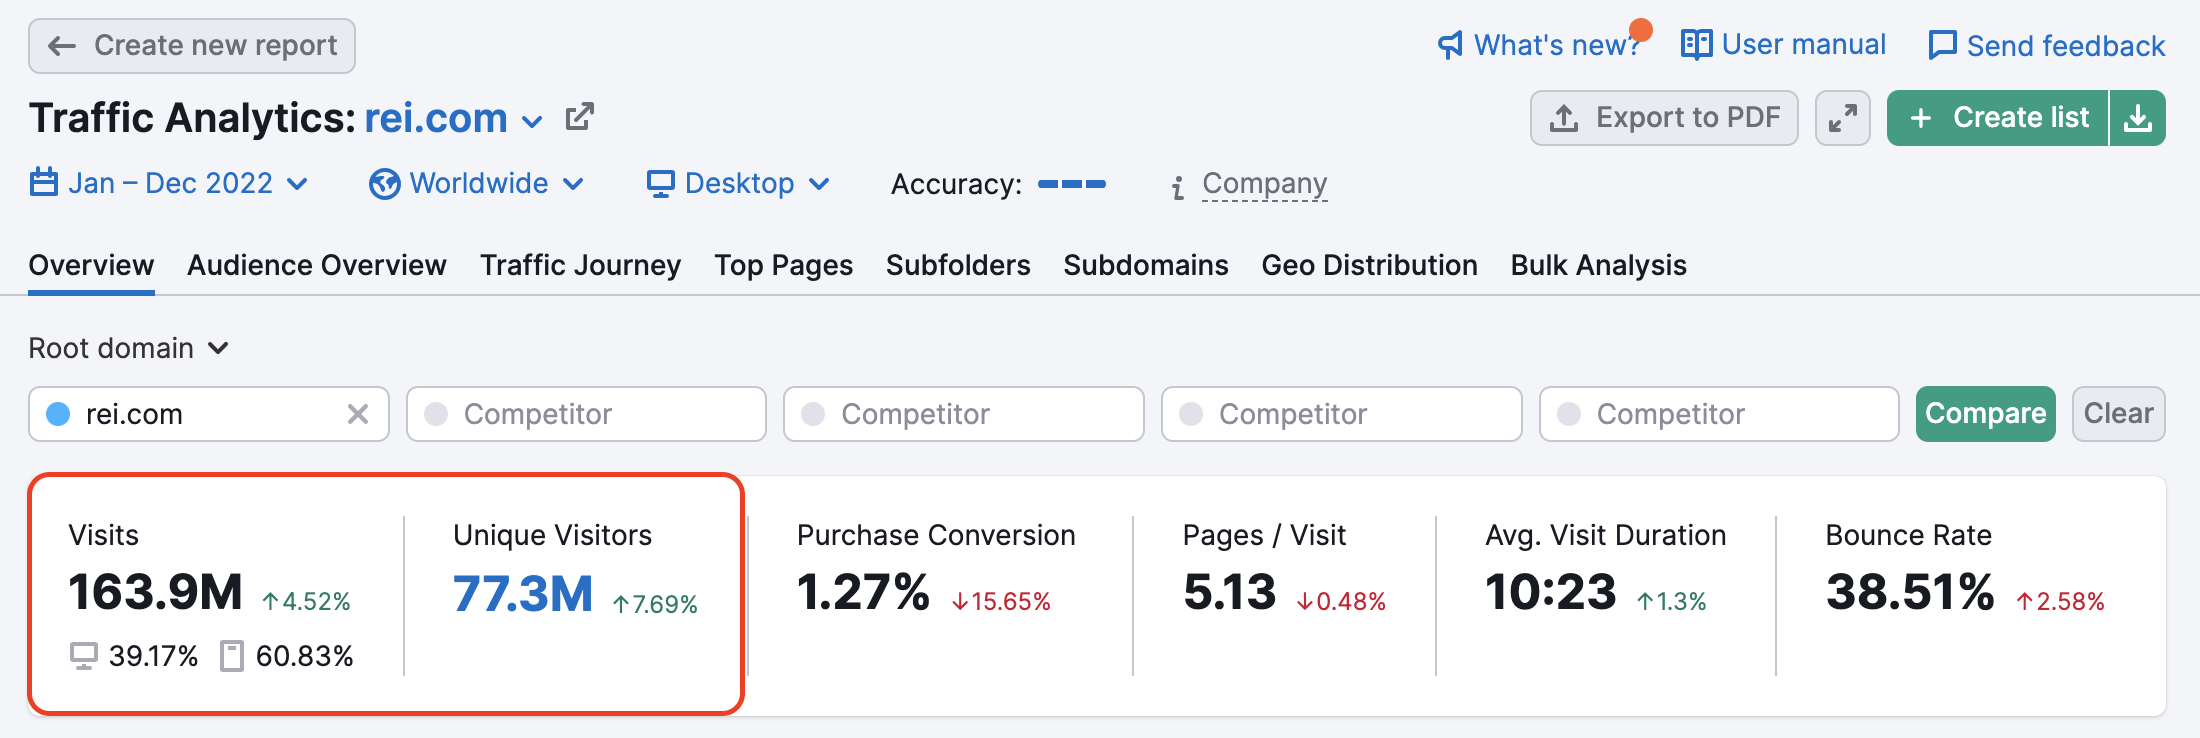
Are they in the range of 1,000-10,000 visits per month? Do they attract more than 100,000, or are they in the millions? The number of visits reflects the audience size, while the number of unique visitors indicates audience growth. These metrics will let you size up the prospect and their audience.
Gauge the Quality of their Traffic
Now, perhaps more important than the size of the audience is the quality and engagement of this website traffic. Average pages per visit, visit duration, and bounce rate can tell you if a partner’s audience is highly engaged or just interacting on a surface level.
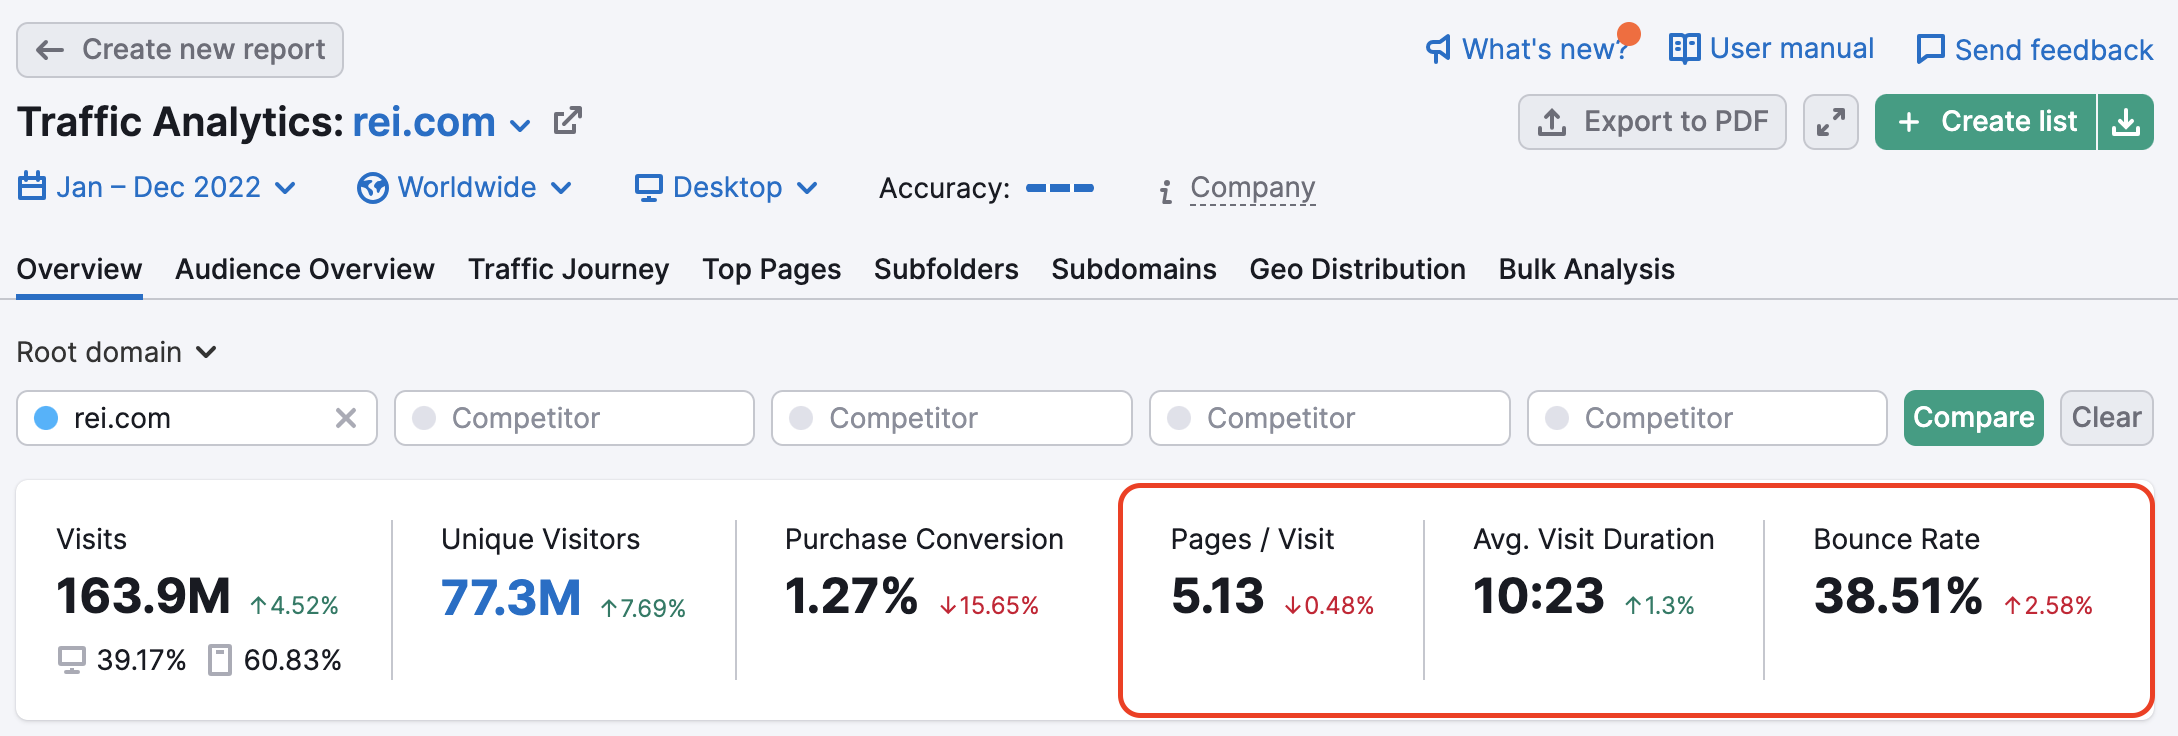
The more pages per visit and longer visit duration, the more the audience is really engaging and spending time with the business - which would all be good signs for a potential partner. A high bounce rate would be a red flag that people aren’t easily finding what they’re looking for, they aren’t engaged by the content, or the site has technical problems.
Analyze Their Traffic Strategy
Once you know their traffic quantity and quality, head over to the Traffic Journey Report to figure out what channels drive the most traffic. The Traffic Channels by Type graph shows the division of their website traffic coming from Direct, Referral, Organic Search, Paid Search, Organic Social, Paid Social, Email, and Display Ads.
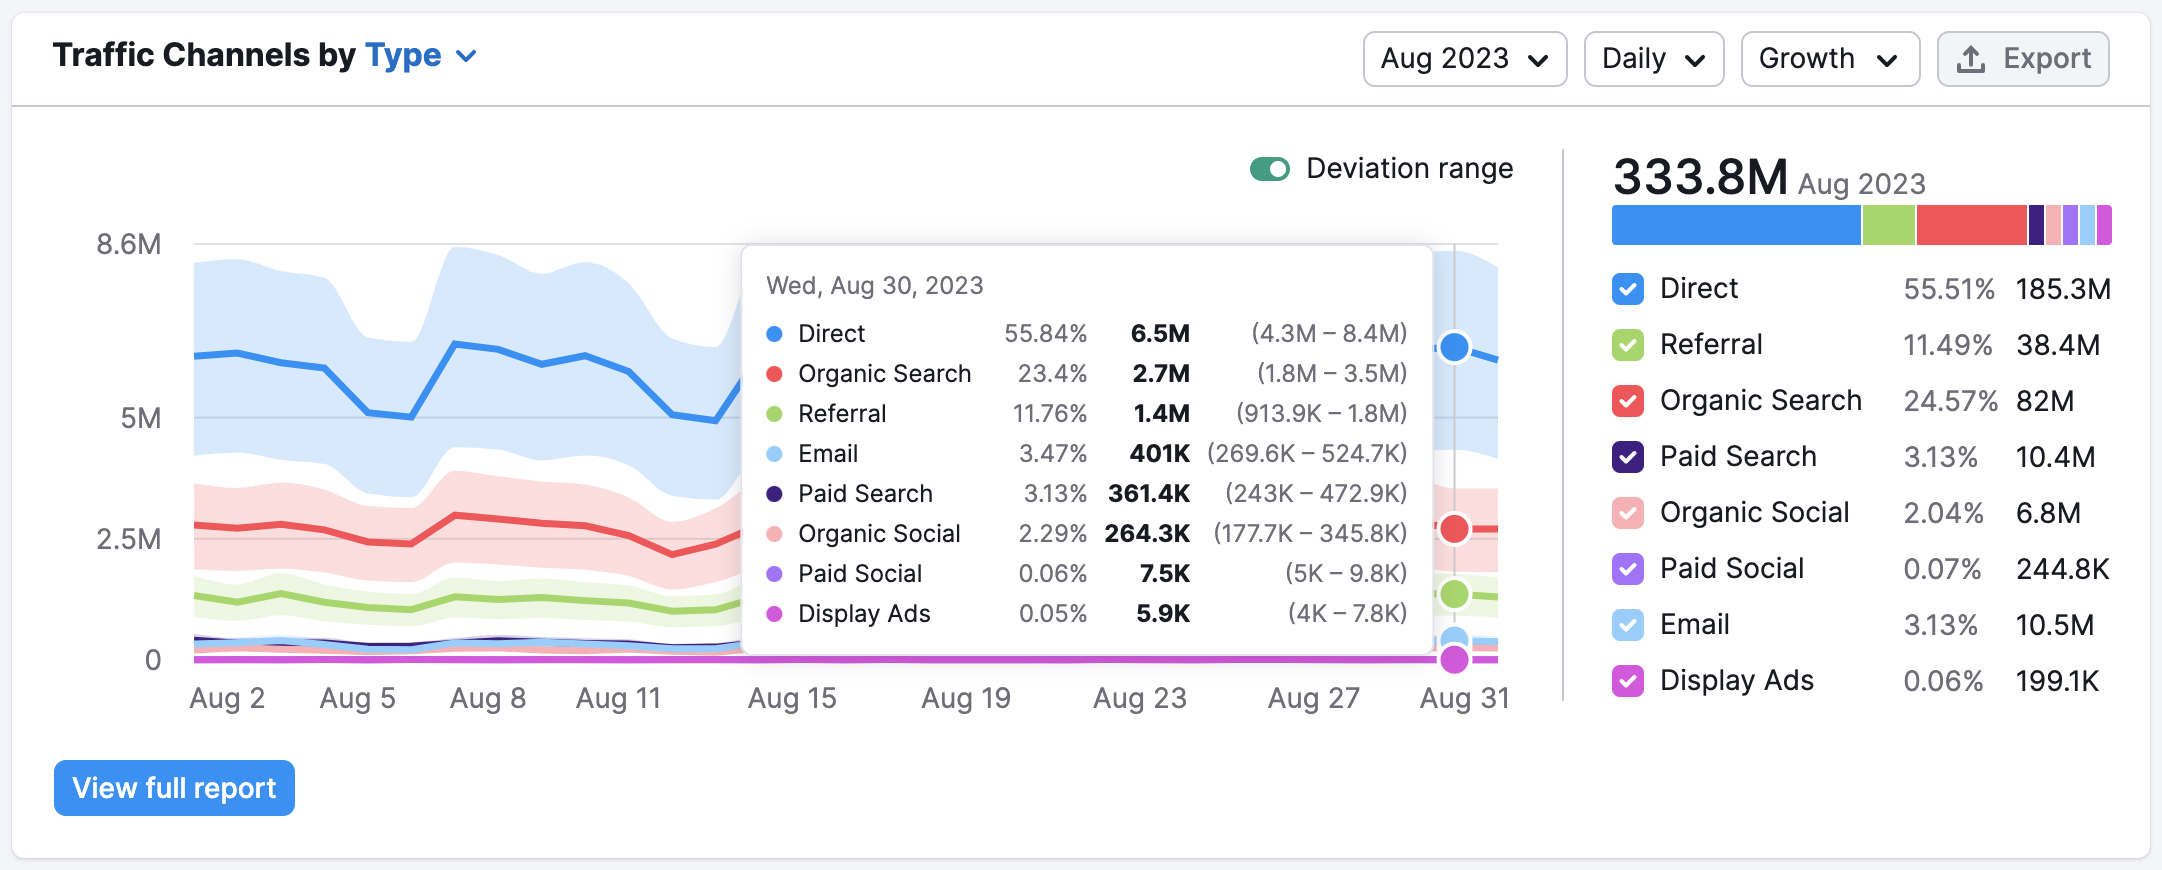
You can see the amount of each channel’s contribution to the site’s total traffic and look deeper into the specific top referring sites, search engines, and social networks sending traffic to the site.
With this information, you can identify their top channels and make plans to leverage their strengths for your business. Or, if your site performs better than theirs in a specific traffic channel (let’s say they have tons of search traffic but no social traffic, meanwhile, you have hundreds of thousands of social visits per month), you can use that as a selling point for your partnership.
Consider Their Current Partnerships
While inside the Traffic Journey Report, you can also use the Traffic Journey Details chart to identify a website’s top destination sites–or the most common websites that users visit after viewing their site. This will give you insight into their current partnerships, and you can consider whether these businesses could also be beneficial partners to you.
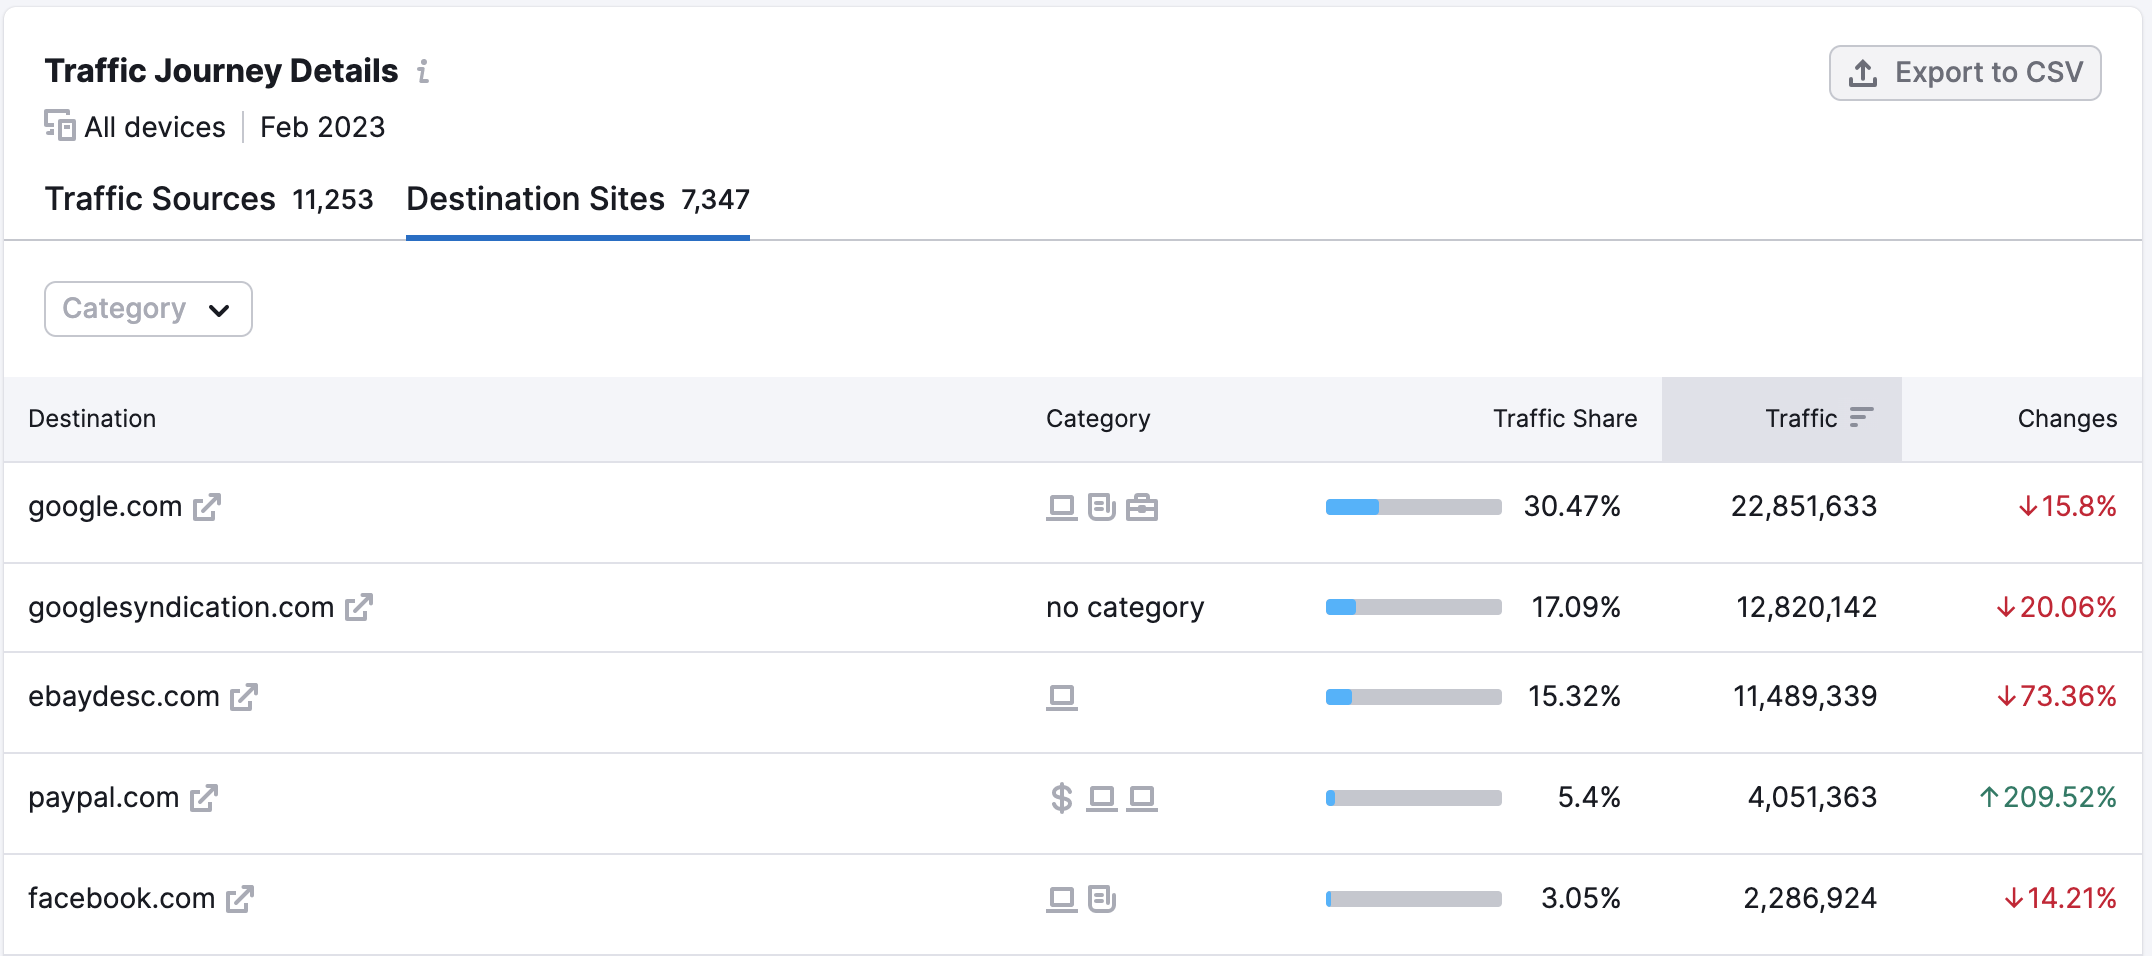
Filtering by industry provides more specific information about your potential partner’s visitors. For example, if you were looking to partner with publications, filtering by “Arts & Entertainment” will highlight industry publications and blogs to your potential partner’s audience visits.
See How Much Your Audiences Overlap
How much of your audiences are the same? You can find out in the Audience Overview Report. The Audience Overlap widget visually presents how much percentage of your website traffic is also a part of your prospective partner’s website traffic.
Enter your domain name in this tool and the website of your prospect as a “Competitor” with the “Add 4 competitors” button at the top of the report. This displays your two audiences and what percentage is estimated to be overlapping.
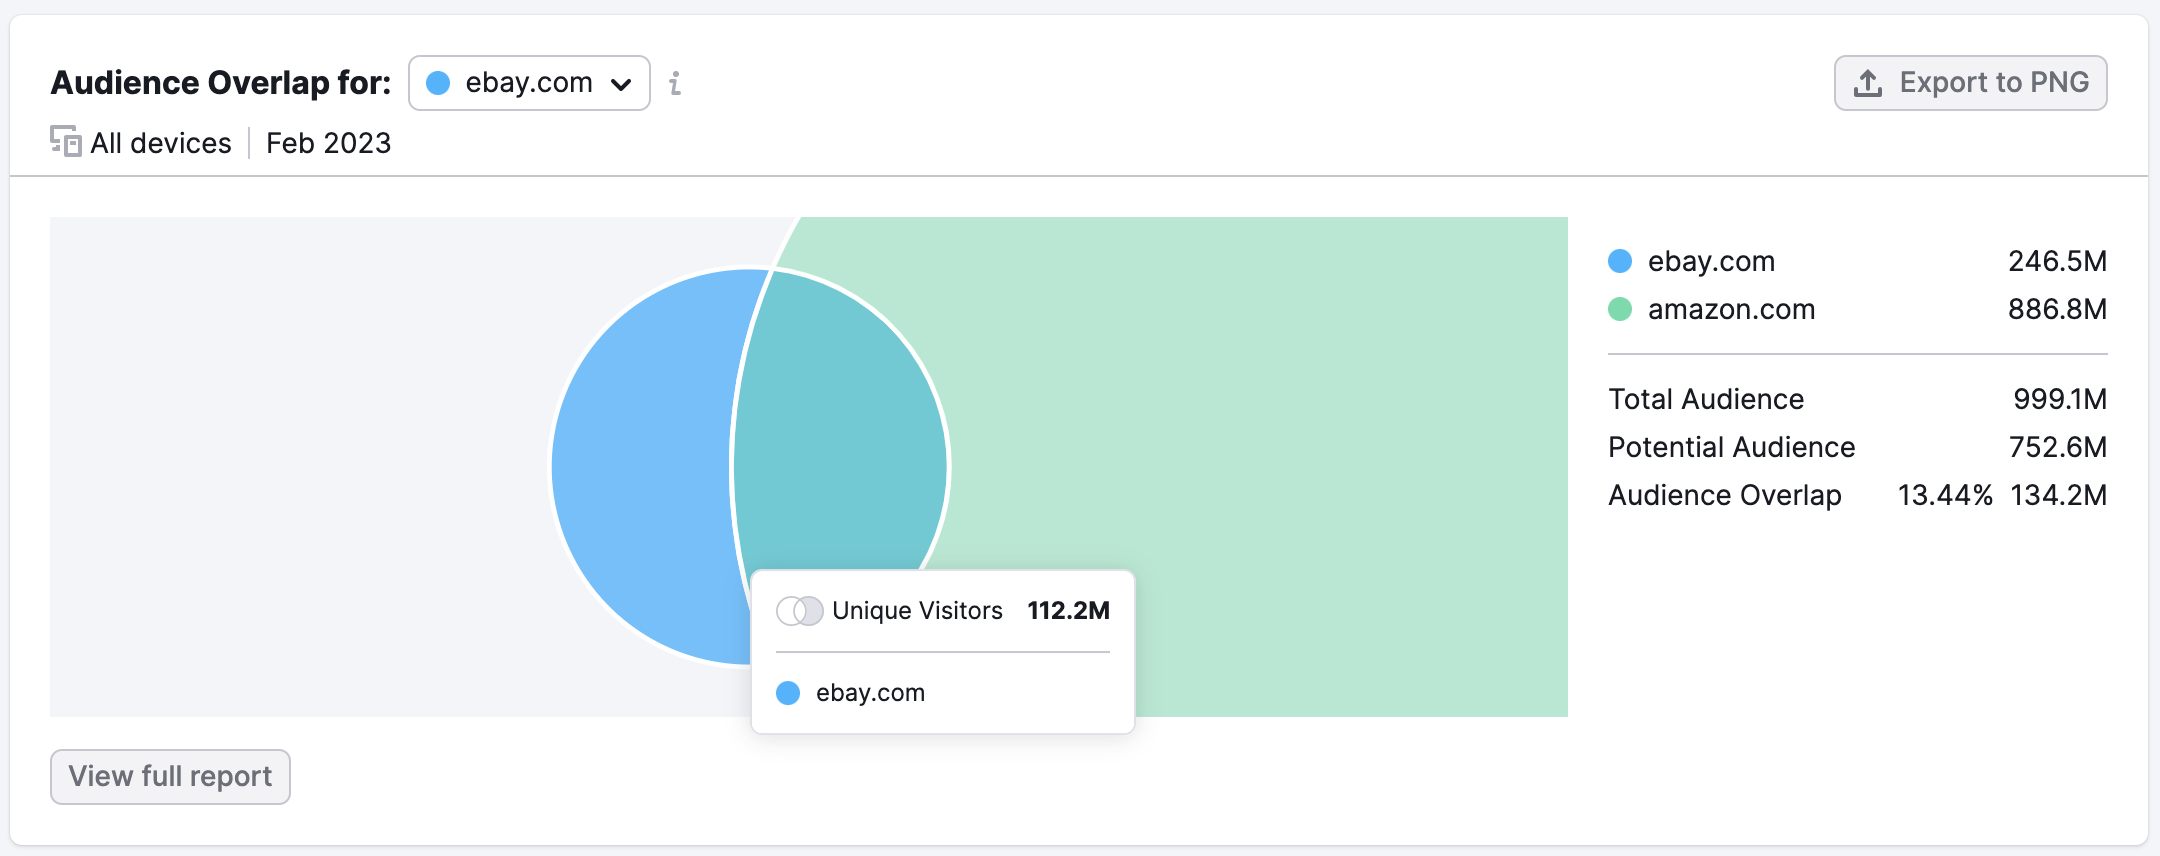
High audience overlap means that you’ve already made some contact with this audience and you’re targeting the same group of people.
Low audience overlap indicates a new market opportunity because this prospect’s audience might not know about you yet.
While whatever you consider high or low overlap is subjective to the industry your site operates in, an overlap of 50% or more would indicate that there is a strong connection between the audiences of these sites.
Spot the Geographic Market Opportunities
What countries does your potential partner cover? Are they relevant to your business?
The Geographic Distribution report will be the report to look at if you are interested in expanding to a specific geographic market through this potential partner. You can identify what percentage of their website’s traffic comes from those markets and how engaged their audiences are in each region (pages per visit, avg. visit duration, bounce rate).
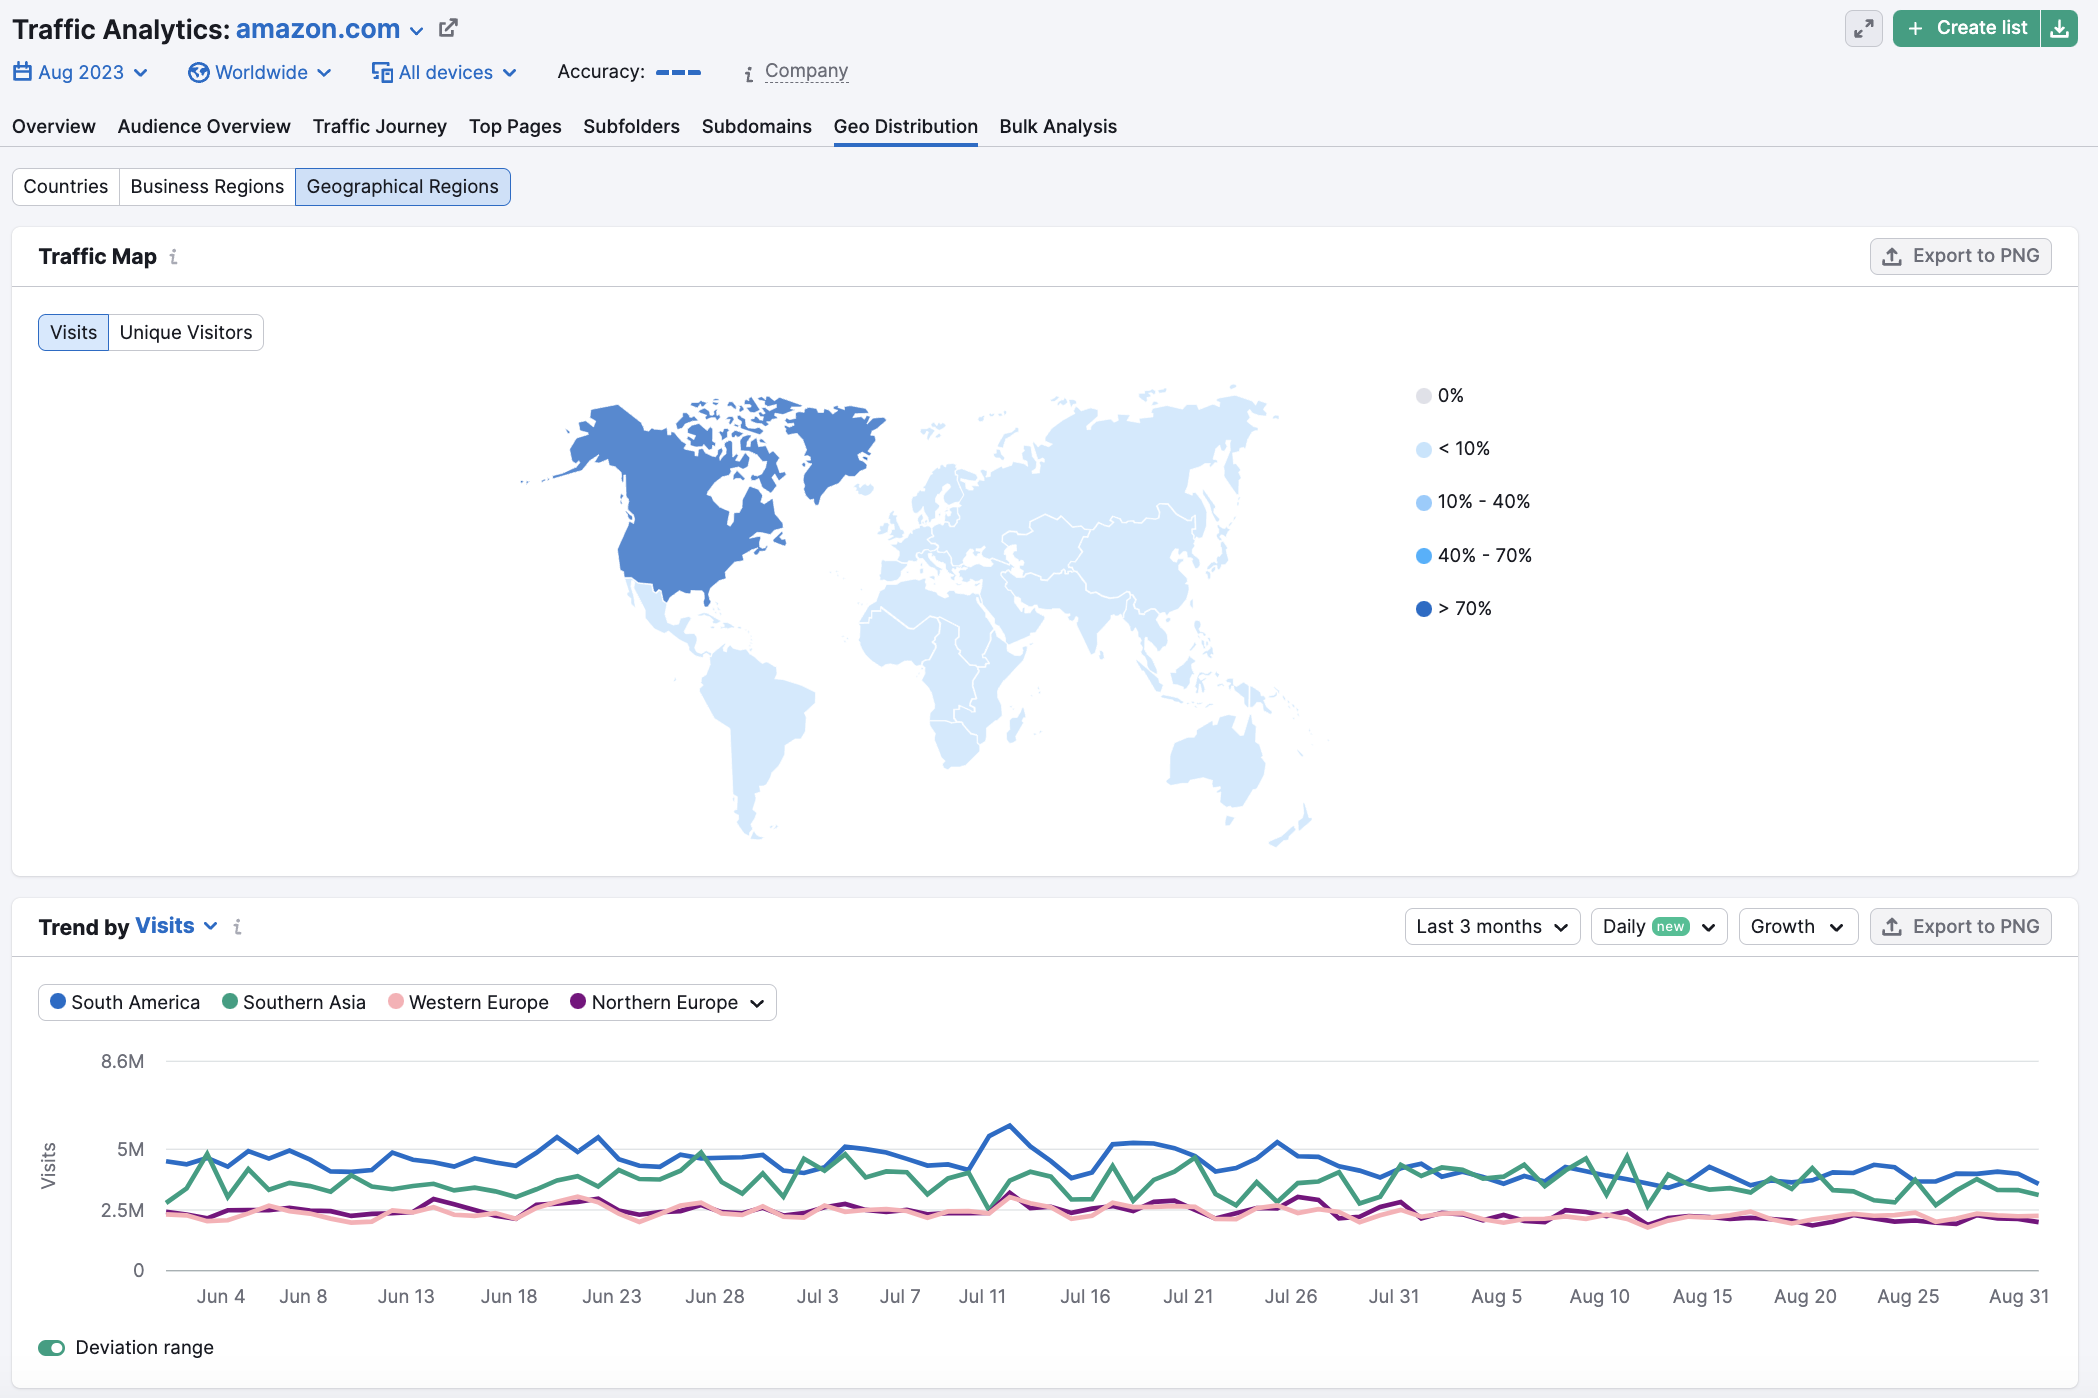
Likewise, if you see that your site has great traffic in a region that your prospect does not, this is a great selling point to tell them that working with you would allow them to reach a new market for their business.
Make Data-Driven Partnership Decisions
Once you’ve examined your prospective partner using Traffic Analytics, you can gauge the potential of the partnership by considering:
- Whether or not the prospect has sufficient, high-quality traffic
- Where you might benefit from or provide support with traffic generation
- How their current partnerships might improve your business
- The extent to which you already engage with the prospect’s audience
- Where your prospect is doing business geographically
With Traffic Analytics, you can rest assured you’re making data-driven partnership decisions.
To save any of this data and prepare a presentation for any interested parties, use the PDF button at the top of Traffic Analytics to export and modify a PDF version of the data in this tool.