Are you tired of manually updating your reports? AI Automated Data Connector is the ultimate solution for you and your data management.
Think of it as your “data warehouse”—where you can import data into Google Sheets in just a few clicks.
Connect your data source and watch as your data is pulled instantly into Google Sheets. Plus, use prebuilt dashboards and reports to join, sync, and manipulate your data.
You can find AI Automated Data Connector in the Semrush App Center.
How Can AI Automated Data Connector Help Me?
- No need to learn a new tool or code—use features and formulas you already know
- Work autonomously and stop relying on tech teams to build dashboards you need
- Connect and sync with tools you use every day (like Salesforce, Marketo, Shopify, and more) in one click, so you never have to leave your spreadsheet
- Your data is automatically refreshed, no clicks required
- Stay up to date and trigger a notification when data changes, is added, or is on schedule
- Preserve your historical data
Pricing
After a free 7-day trial, the AI Automated Data Connector subscription costs $25 a month.
Additionally, you can purchase an AI ChatGPT Copilot for your Data in-app for $10 a month.
To learn how to add an app, visit the App Center’s guide on how to add apps.
Prebuilt Integrations
Unlock the full potential of your ecommerce and marketing data with prebuilt integrations for products like:
- Semrush
- Shopify
- Gorgias
- Klaviyo
- Google Analytics
- Google Ads
- Facebook Ads
- Pinterest Ads
- TikTok Ads
- Snapchat Ads
- Google Sheets
And more! (There are over 50 integrations.)
Navigating Segments within AI Automated Data Connector
Let’s start off with how to get into the app itself. Once you’re on the AI Automated Data Connector landing page, you’ll see a “Go to app” button. Click that:
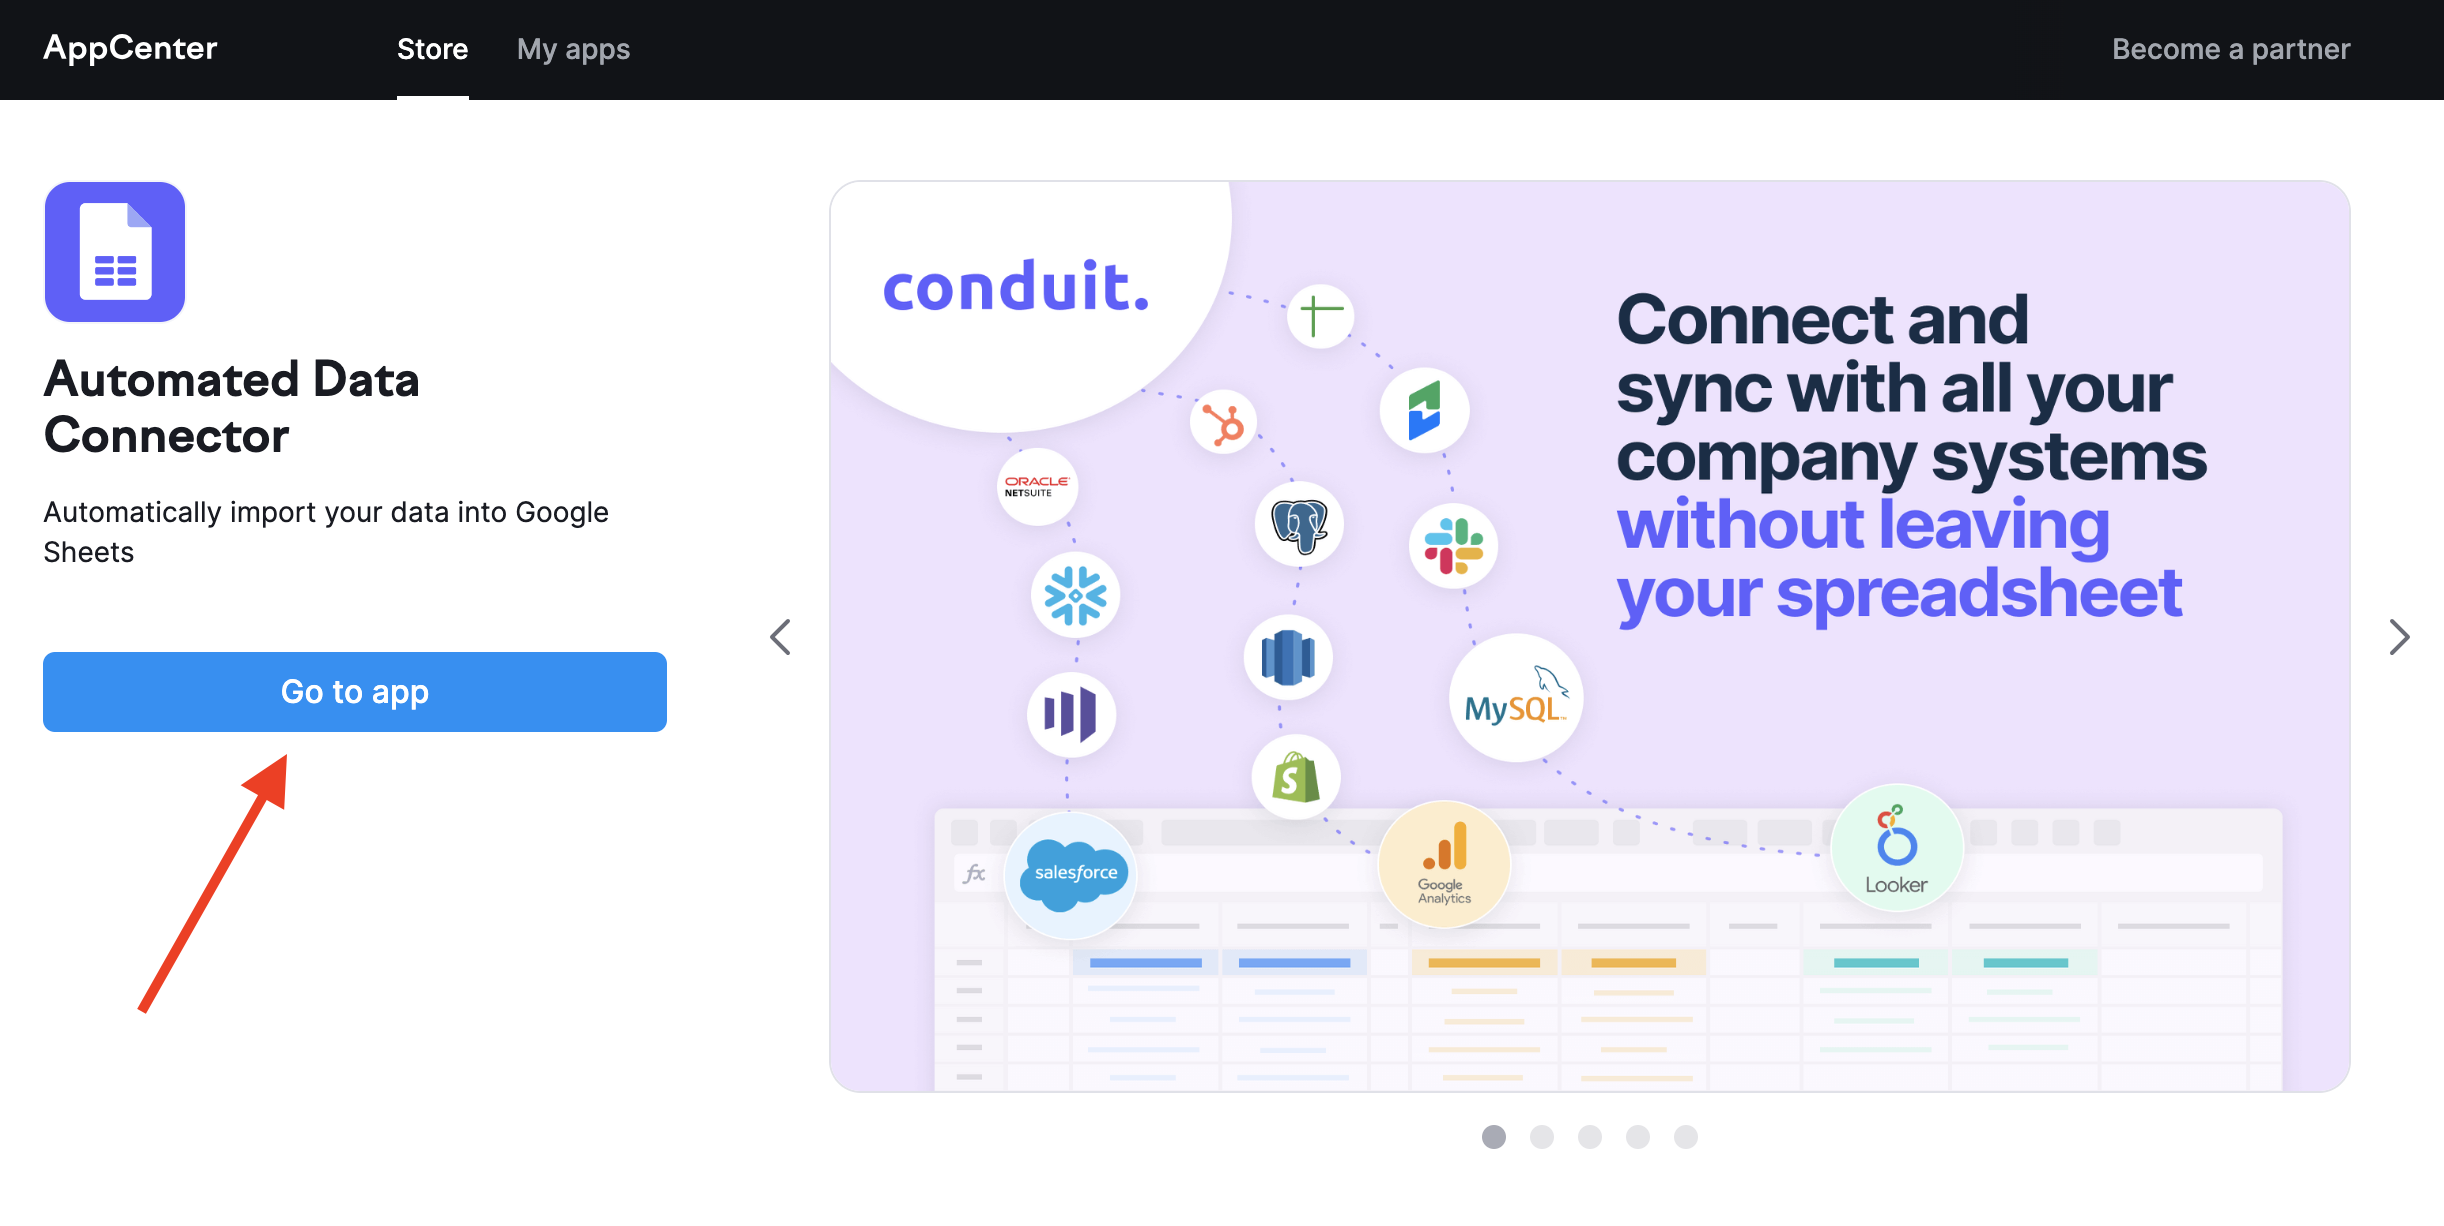
You’ll then see this page. On the left-hand side, you’ll notice all six of the segments within AI Automated Data Connector:

Now you can choose which segment you’d like to use!
Capabilities
Let’s break down what each tab offers. We’ll begin with Imports using Google Ads Integration as an example. You can use Imports for everything importable from the sources available for connection.
Imports: Google Ads Integration
By clicking “Imports” from the left-hand column, you’ll be brought to a page that looks like this:
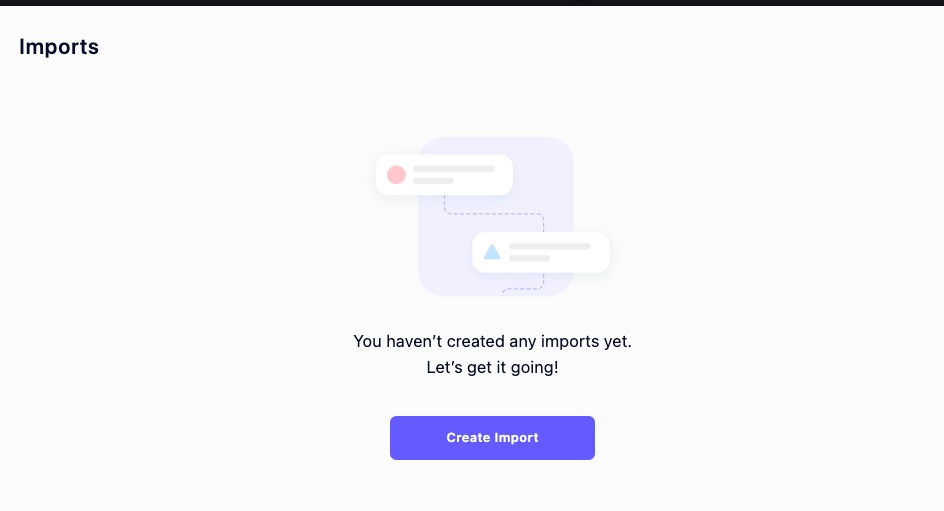
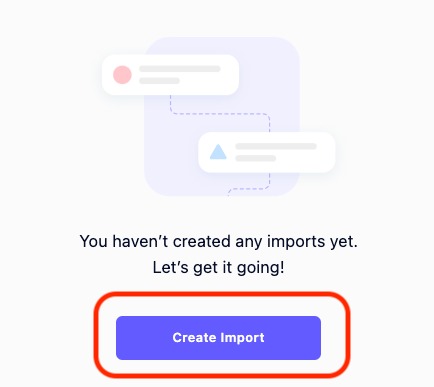
Once there, click “Create Import”:
From there, the next screen will include options for tools to export data from. To do so, click the “Connect” button next to the app you’d like:

Make sure to scroll down the page to see all of the tools offered!
For this example, we are importing Google Ads using a demo connection. Once you’ve clicked “Connect” for Google Ads, your page will look somewhat like this:

In this case, the title of the project is “Google Ads (Demo) [Ads].”
Here are the steps to follow in order to generate your data:
Step 1: Select your time frame
Choose which dates you’re looking to import data from by clicking the calendar icon:

Select from as recent as yesterday to as long as two years ago.
Step 2: Customize your table
You’ll have three options for customizing under the “Customize table” tab, featured in the upper-right corner of your screen:

- Choose how your table is categorized under the “Breakdowns” tab:
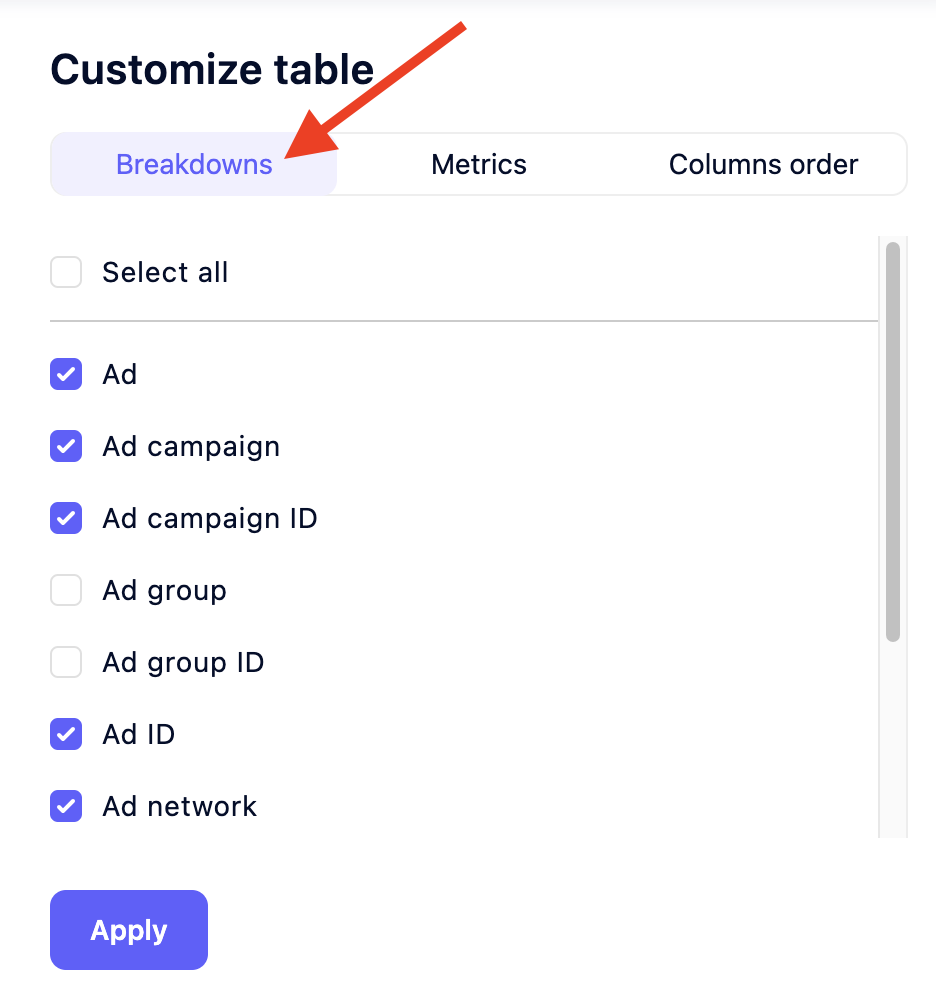
- Choose the metrics displayed under the “Metrics” tab:

- Choose your column order under the “Columns order” tab:

Once you’ve selected your choice(s), you will see a ✔.
Step 3: Filter your data
Once you have your table customized to your liking, filter your data by the following options:
- Ad
- Ad ID
- Ad campaign
- Ad campaign ID
- Ad group
- Ad group ID
- Ad network
- AdAccount
- AdAccount name
- Country
To view or select these options, press the three-dot button on the right-hand side of the toolbar:

Step 4: Export your data
Click the “Export” button in the upper-right corner of your screen, and you will be able to export your data to Google Sheets, a CSV file.

If you decide to export your data to Google Sheets, choose your Google Sheets URL:
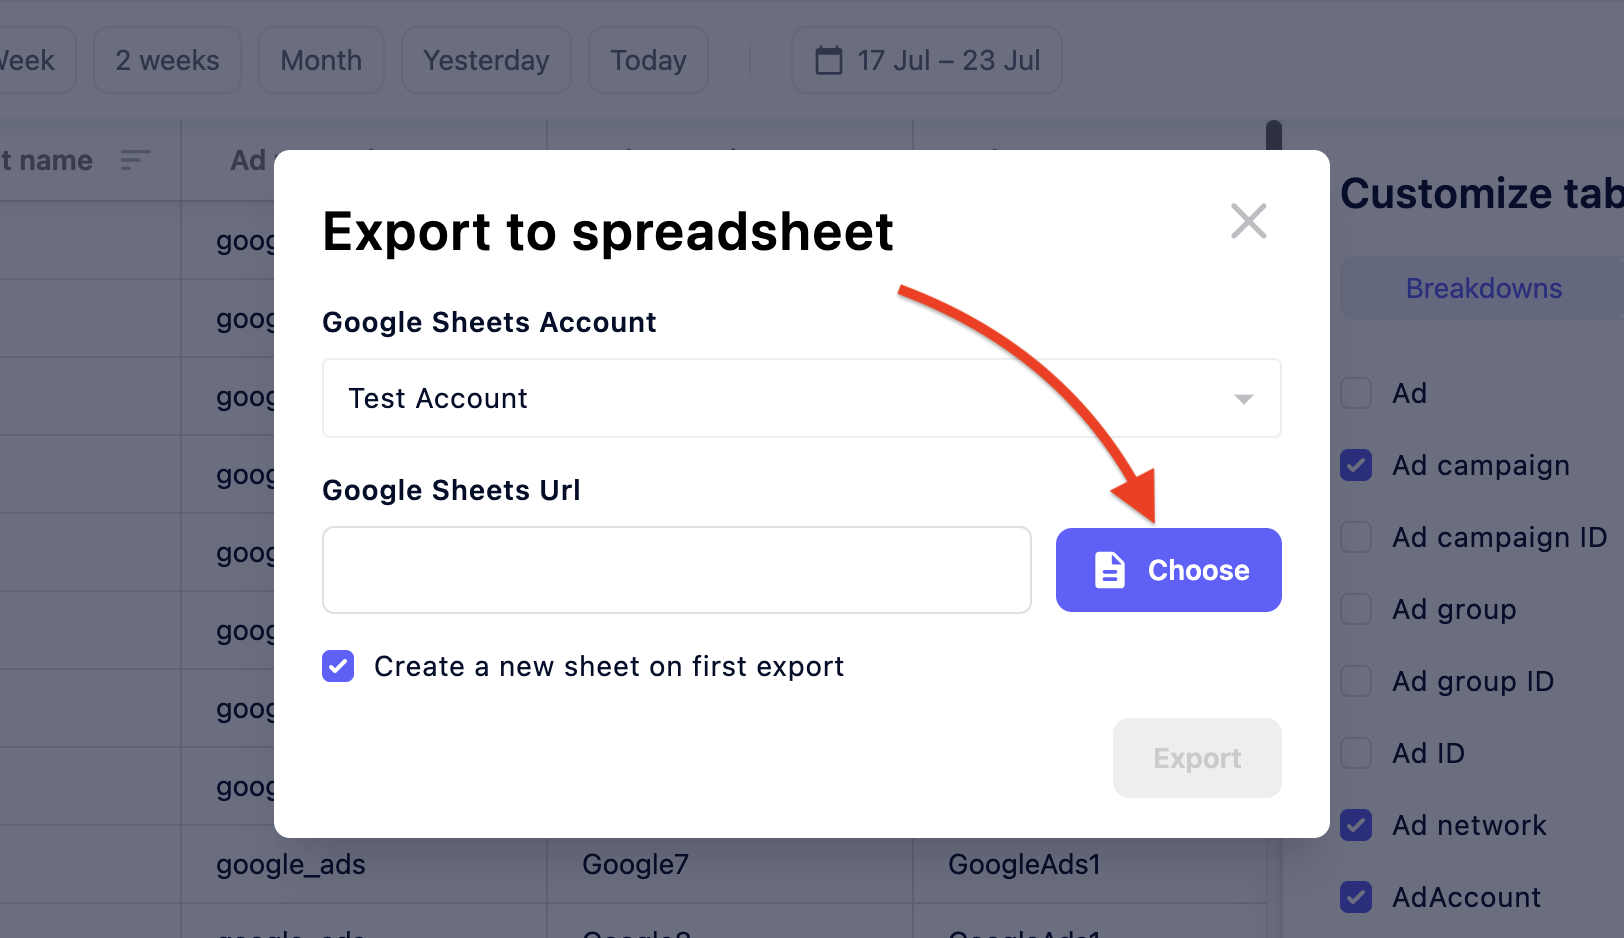
Once you click the “Choose” button, this screen will appear:

After you’ve selected your spreadsheet, the below screen will appear. Click “Export”:

Once exported, you will receive this notification on the lower-right bottom of your screen:

- Click “Open the spreadsheet” to see your exported data
- Click “schedule” to arrange automated updates
- Click “return” to see your list of imports
Viola! You have successfully imported your Google Ads data.
There are many other data options to import from. See all of them under the Prebuilt Integrations section above.
Templates
Templates allow you to launch prebuilt dashboard templates into Google Sheets. Ten options are available, ranging from customer support templates to marketing and sales.
Once you’ve clicked the “Templates” option on the left-hand side of the AI Automated Data Connector landing page, your screen will look like this:

Connections
Once you’ve clicked the “Connections” option on the left-hand side of the AI Automated Data Connector landing page, your screen will look like this:
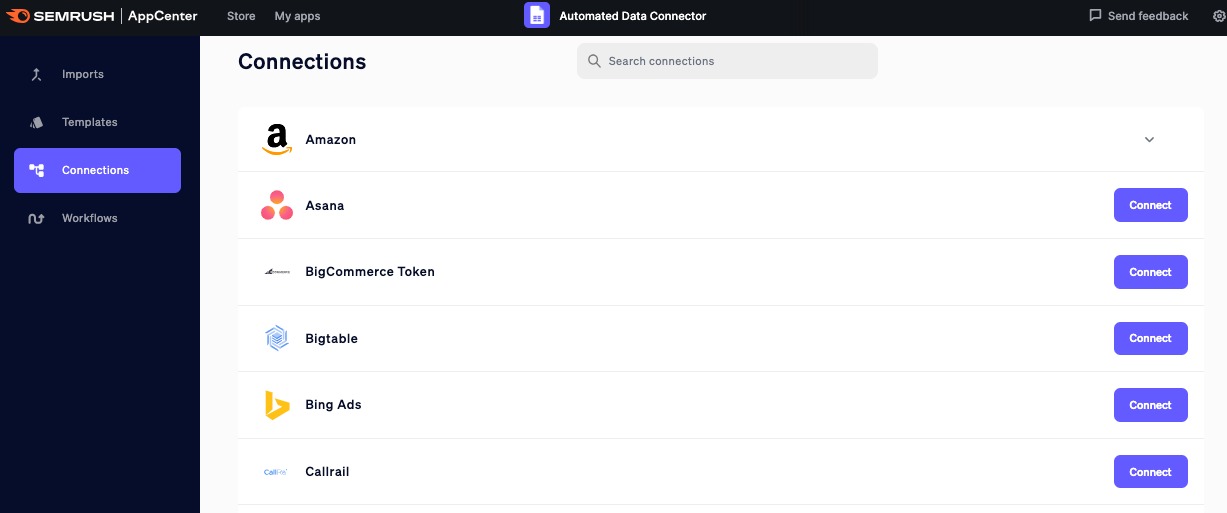
You will see the accounts you have connected already and the options you can add.
To select an account, scroll down the page to the account you’re interested in adding. In this case, let’s add Slack:

Click “Connect” to connect to Slack.
You’ll then see this screen:

Click “Connect Slack.”
You’ll then be directed to this page:
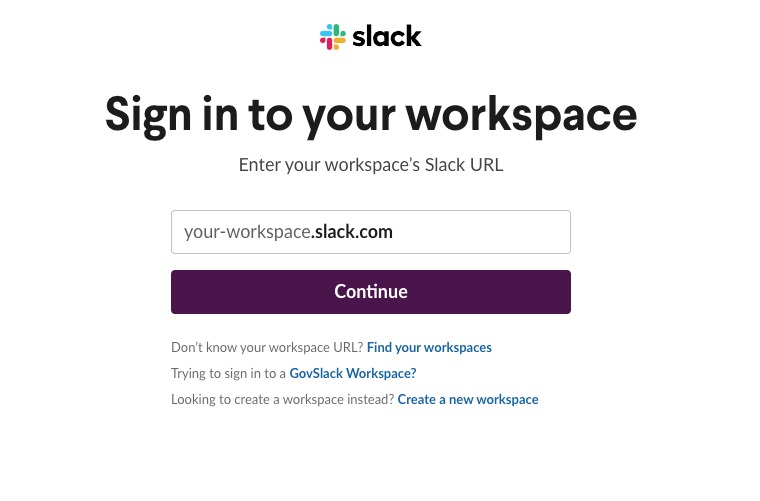
This is where you provide your Slack workspace URL. Connecting Slack will allow the app to receive the report’s data as a CSV or as a dataset statistic report.
Workflows
For users who may not feel 100% confident in their programming experience (or would prefer data processed for them), “Workflows” lets you build a big data pipeline and send the data to your selected destination.
Once you’ve clicked the “Workflows” option on the left-hand side of the AI Automated Data Connector landing page, your screen will look like this:

Press “Create workflow” to begin. You’ll then see this screen:

This is where you can:
- Pick a name for your workflow by pressing the pencil button
- Select a timeframe for your data
- Start a workflow including sourcing, transforming, filtering, and sending data
All you have to do is:
- Drag your desired action to the canvas in the middle of your screen
Once that’s completed, choose which source and account you’d like data pulled from:

Sourcing Data
There are several options available to users who want to build a workflow that involves data sourcing.
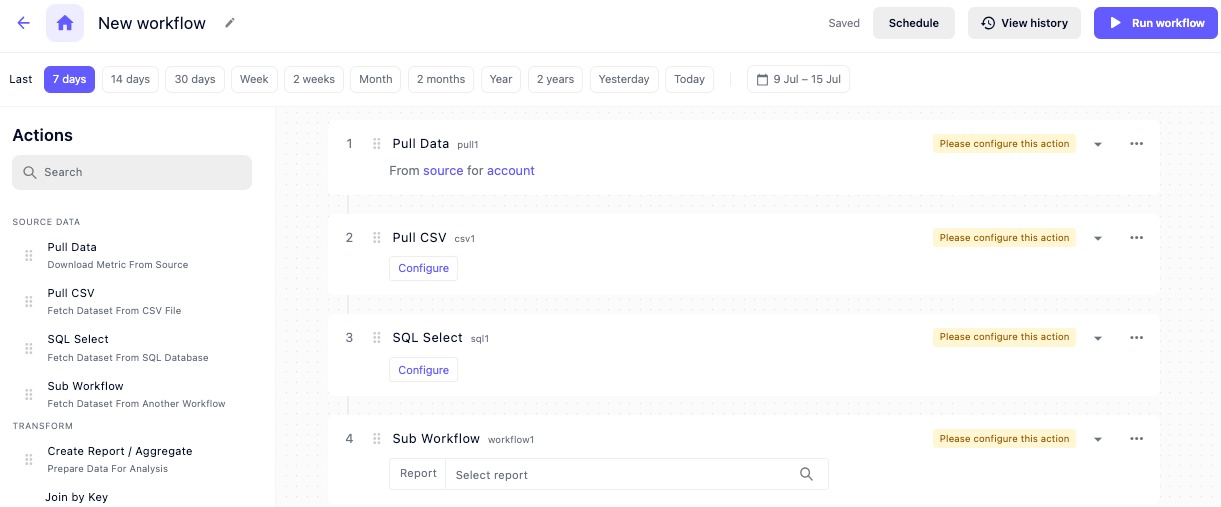
You can:
- Pull data from your data sources
- Fetch data from a CSV file
- Collect information from an SQL database
- Pull a dataset from another workflow
Transform
There are many options available in the Workflows tab if you are looking to transform or shape your data in a specific way during your workflow:
- Create Report/Aggregate - Create a report for data analysis
- Join by Key - Join two datasets related by a single column key
- Union Datasets - Join datasets together
- Add Metric - Create a custom metric
- Add Column - Create a custom column
- Add Week/Month/Year - Generate columns for those date ranges
- Split Column - Split text columns by commas
- Join for Ecommerce - Join ecommerce-related datasets
- Transpose - Transpose rows and columns of a dataset
- Pivot Table - Arrange and summarize complex data
- Cohort - Make a dataset for cohort analysis
Filter
You can build a workflow that filters your data with a few options as well:
- Filter - dimensions and metrics
- If Then - conditions and actions
- Deduplicate - Deduplicate columns
- Change Time Zone - Change the time zone column
Send
Finally, you can build a workflow that sends your data through multiple channels:
- Save Dataset to Google Sheets
- Send to Email
- Send to API
- Send Status Report via Slack
- Send CSV to Slack
- Send Status Report via Email
- Send Dataset to Snowflake Table
- Send Dataset to Bigtable
Once you have made the above selections, your workflow will look something like the image below.

Press “Run workflow” in the upper-right corner of your screen:

In just a few seconds, your workflow will appear!
Once it’s ready, you’ll see several options to download:

Select which option is best for you.
AI ChatGPT Copilot for your Data
Copilot is like having an AI analyst for your data. It can answer questions based on previously connected data or CSV/Excel files that you've uploaded.
It cand give you both general answers, such as total spend or total revenue, as well as datasets, such as combining and aggregating data from two different sources.
Additionally, you can ask questions specific to your own data, such as "What is my most profitable category?"
You can access the Copilot feature from Home by clicking on the Ask AI button or using the dedicated Copilot option on the main left menu.

When you start a new chat, you can either start typing your question right away or use the ready-made prompts above the Message Copilot input field.
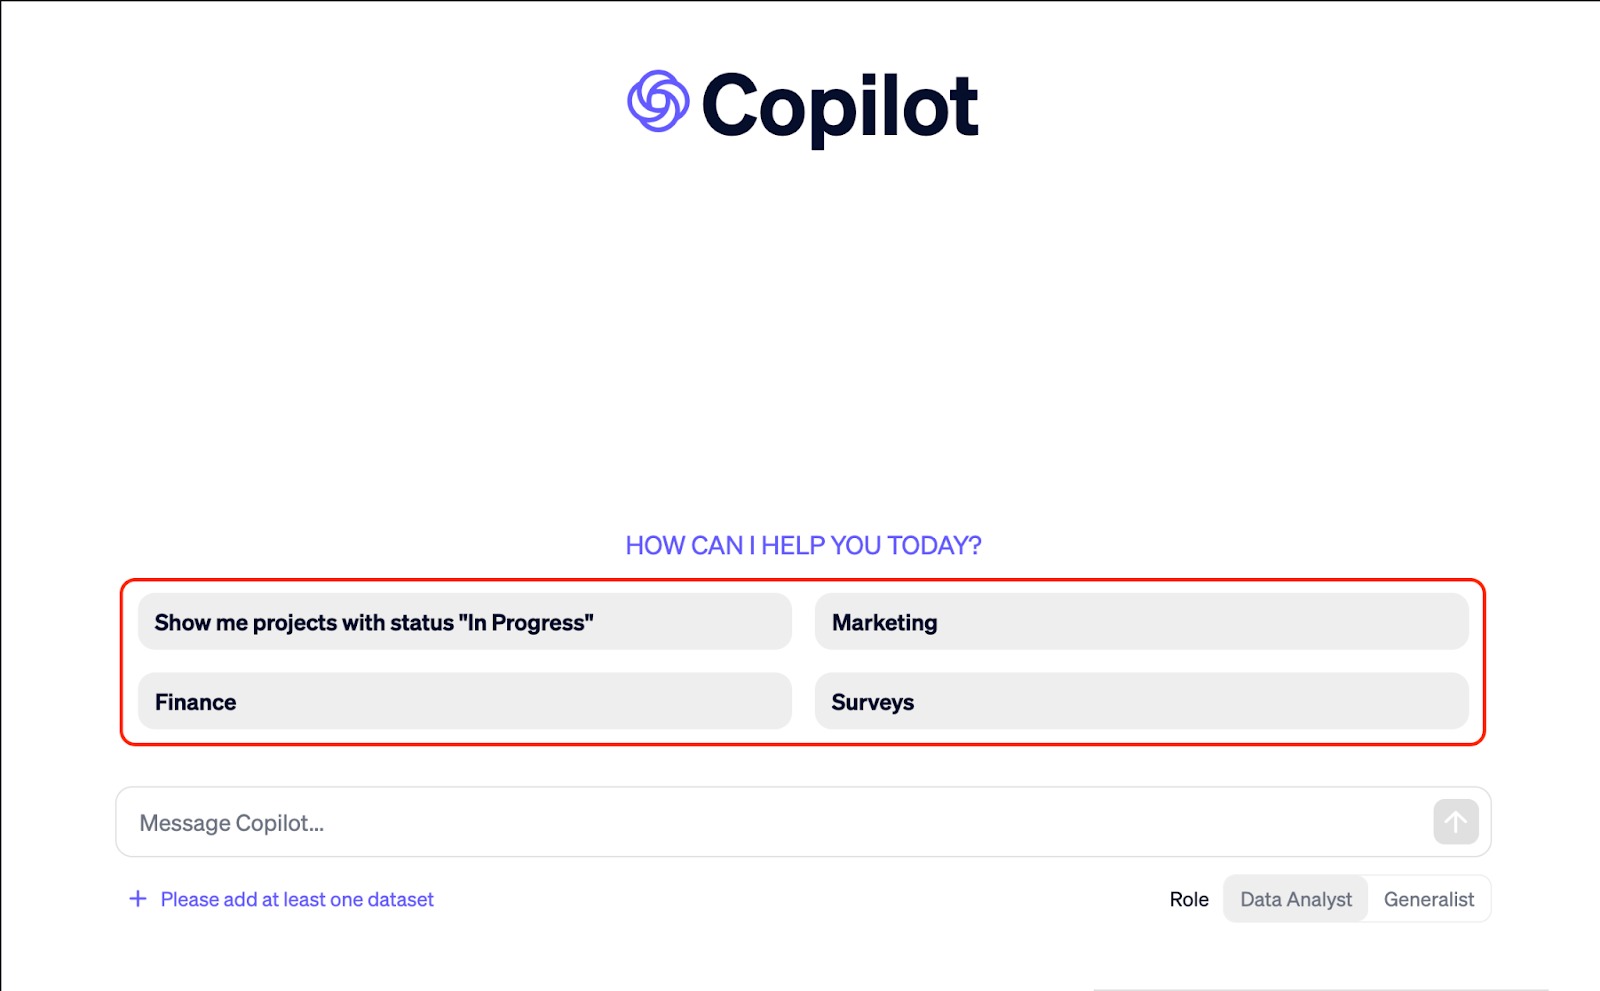
For example, the Finance section includes prompts like Find growth, For every client show the first and the last month on the record, and Create a P&L.

There are two roles available for the Copilot: Data Analyst and Generalist.

Data Analyst: In this role, Copilot focuses on numerical data analysis. It provides accurate calculations and can handle extensive datasets.
Generalist: In this role, Copilot can address a broader range of open-ended questions. However, the accuracy of the calculations may vary, and the volume of data it can process is limited.
To find your previous chats or start a new one, unfurl the Chats menu hidden in the upper right corner of the interface.

Frequently Asked Questions
By using the AI Automated Data Connector app, you can seamlessly connect a wide range of Semrush data, including:
- Semrush URL Paid Search Keywords
- Semrush URL Organic Search Keywords
- Semrush Keyword Overview
- Semrush Domain Analytics and Tracking
If you have questions about the AI Automated Data Connector App, please email us at [email protected].