The One2Target Behavior report allows you to view audience behavior data for selected domains across specific time periods and locations.
With the Behavior report, you can uncover:
- Adjacent audience interests
- Preferred devices audiences use to access the web
- Top social media platforms used by the audience
To begin, enter up to five domains to compare. Once you enter your selected domains, make sure you’ve also defined your desired timeframe, location, and device type at the top of the report.

Interests
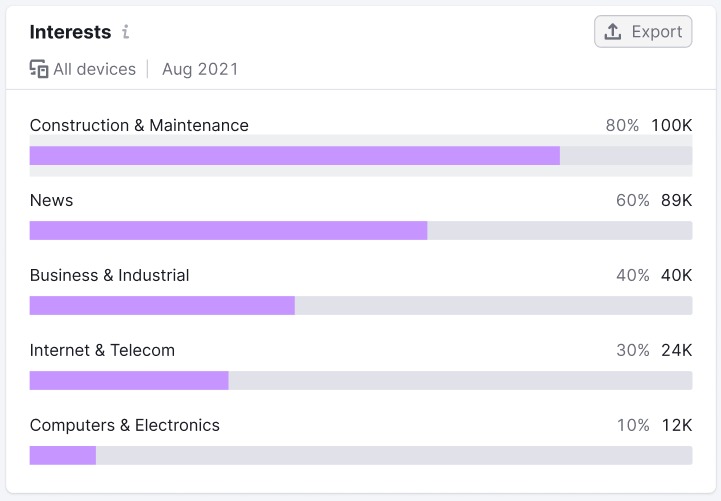
The Interests graph is the first you’ll find in the Behavior report. This graph reveals the top interests among members of the audience. To the right of each bar, you can view the share and number of audience members in each category.

Device
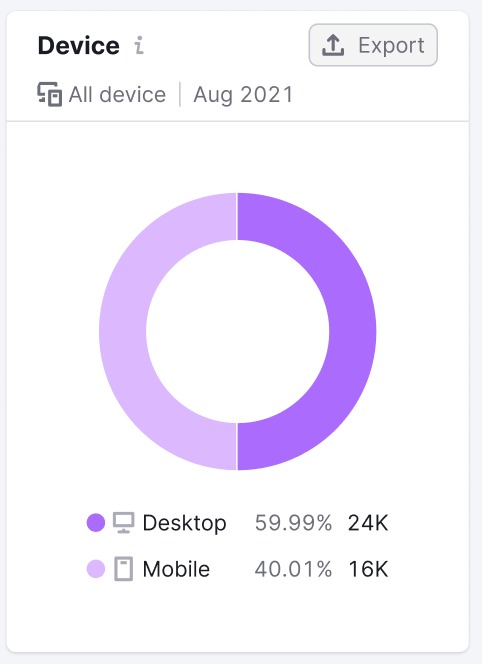
The Device widget shows the breakdown of device usage among the audience. The darker shade depicts the portion of the audience that uses desktops, and the lighter portion reflects mobile devices. Below the chart, you can see the share and number of audience members who use each device type to surf the web.

Social Media
The Social Media graph offers a breakdown of the audience according to their social media preferences. In this graph, you’ll discover major social media platforms, including:
- Youtube
- VK
The bar graph shows the social media platforms visited most often by your audience. You can also view the share and number of audience members who prefer each social media platform.

As with any of the above widgets, you can download the charts in PNG, CSV, or Google Sheets formats. Just click the “Export” button and select your preferred file type to download.