What Is Web Analytics?
Web analytics is the process of working with website data to improve the user experience (UX) and site performance. And includes creating goals, collecting and analyzing data, and making decisions based on your analysis.
Digital analysts, ecommerce specialists, UX designers, product managers, and content managers all rely on web analytics to perform their jobs.
The most widely used web analytics tool is Google Analytics. Here’s a snapshot of what the platform can show you:

But there are other products (which we’ll discuss later in the article) that can produce similar results. These types of analytics tools help marketers and analysts in several important ways.
Benefits of Website Analytics
Website analytics helps to make sense of your website and your online visitors. So you can continually improve performance.
Below are some of the specific ways you can benefit from using website analytics.
Understand Your Audience
Website analytics tells you how your website visitors interact with your site. And can help answer important questions like:
- Which pages do visitors view the most?
- Which pages are holding attention?
- Which pages lose visitors?
- How many visitors are coming for the first time vs. making a return visit?
- How are visitors interacting with your site content?
Here’s Google Analytics data showing the most-viewed pages on the Google Merchandise Store demo account. You can see page views, the number of unique visitors who have viewed those pages, and the average time they were actively engaged with the page.

As you learn more about your audience through data like this, you can craft better content and a better website experience.
Determine Your Top Conversion Actions
Google says a conversion is any “user action that you count because you consider it important.” And what’s important depends on the purpose of the website.
For example, an online purchase is likely the most important conversion for an ecommerce website. But a form submission may be the most important conversion for a B2B company that wants to drive leads.
Whatever the conversion is, you can record data about it and measure how efficient your site is in generating that specific action. Then, you can work to improve those conversion rates.
Here you see the conversions for the Google Merchandise Store demo account. The 1,496 purchase conversions are undeniably the most important. But the view_item conversion (102,361 occurrences) and add_to_cart conversion (25,626 occurrences) are also important.
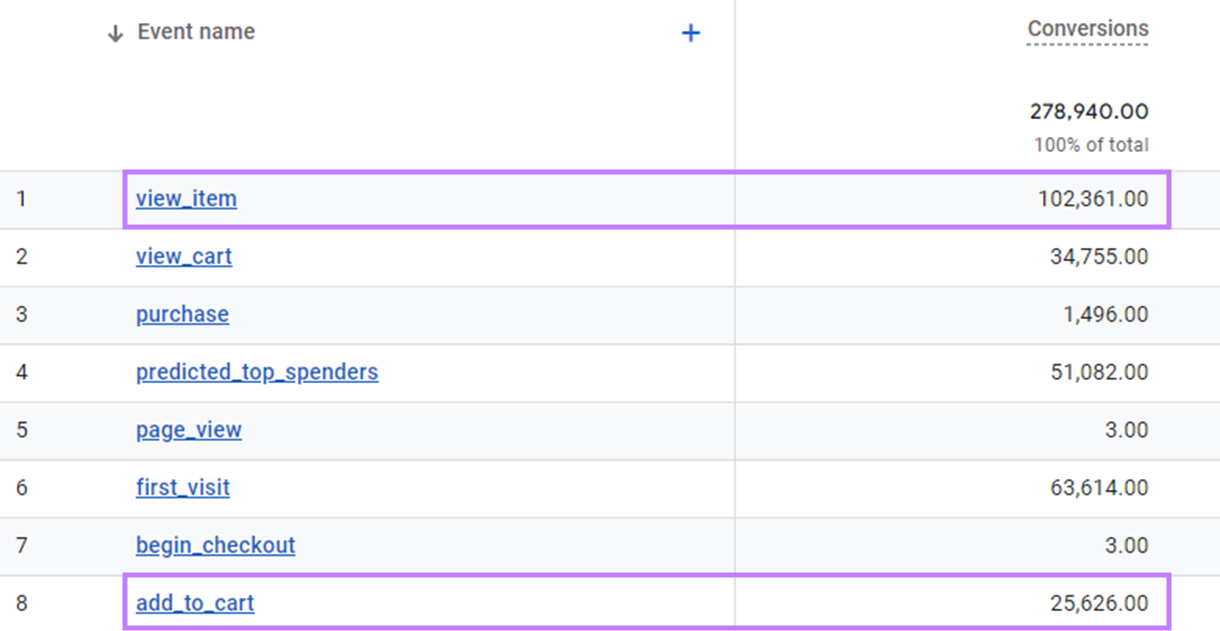
When you compare those second two numbers, you can see that 25% of all item views translate to adding the item to a cart. That 25% can be used as a baseline, and the team can see if they can improve results from there.
The team might try to improve by adding customer reviews and video demos on product pages. Small improvements in conversion efficiency can make a big impact in the overall performance.
Manage Your Advertising Budget
Web analytics can tell you how many visits and conversions you get from various traffic sources. Like paid search ads, paid social ads, email marketing, and organic search.
Here, you can see budget and conversion data from the Google Ads platform for a business that generates new clients through completed contact forms.
This search campaign has generated 92 conversions with an advertising cost of $1,877.75 during the time period in question. Combining those two metrics yields a cost per conversion of $20.41.
The current budget is $30.50 per day, and that can be adjusted as needed.

Web analytics data like this helps you make smarter decisions about your advertising budget.
You might choose to shift budget between multiple Google Ads campaigns. Or even to shift budget between Google Ads and Meta Ads if you saw different results in terms of conversion efficiency.
Find Ways to Improve the User Experience
Web analytics can alert you to issues like your links breaking or going to the wrong destination. Or when the URL of a destination page changes, a webpage gets deleted, or a large image causes a page to load slowly.
Here, you can see the internal link issues from Semrush’s Site Audit tool.
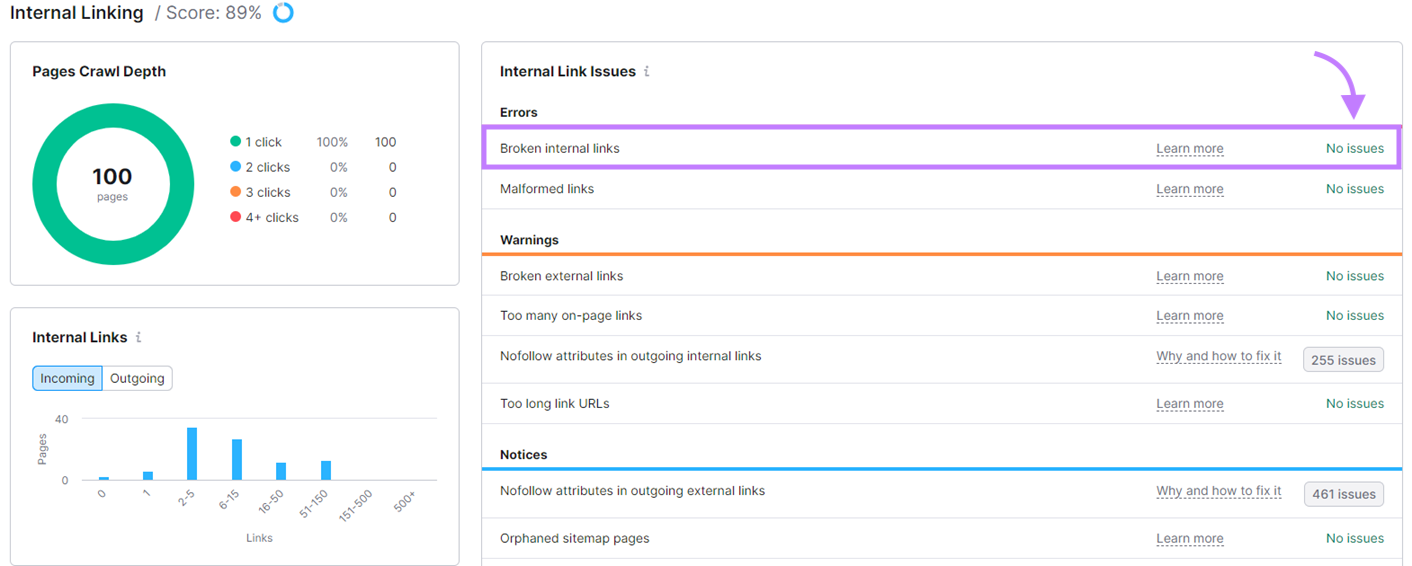
There aren’t currently any broken links. But if that ever changes, this report will quickly flag it. So any problem links can be fixed.
Increase SEO Potential and Drive More Organic Traffic
If you work in SEO, web analytics can help you measure the performance of your content and identify places for improvement.
Tools like Google Search Console show organic search data at the page level and the keyword level.
You can see that one of the keywords (or queries) for “fever blisters” for this website has dropped in rank from 14.9 to 19.9. And impression volume and click volume have declined.

An SEO analyst could quickly identify which page is associated with the drop and put together a focused plan to improve the ranking position for that particular keyword.
Examples of Metrics to Track Using Website Analytics
Metrics are quantitative measurements that help you understand your analytics performance.
The specific web metrics you prioritize should rely on your company’s unique measurement goals. That said, the following metrics are broadly applicable and worth reviewing for most organizations.
Both metrics and dimensions are used to track your web analytics data. While metrics are quantitative measurements, dimensions are attributes that help you understand those quantitative metrics.
You’ll see how metrics and dimensions work together as you read below about sessions, users, and traffic sources.
Sessions and Users
Whenever a user visits your website, it counts as a session.
While sessions equate to visits, users count toward the number of unique visitors.
For example, let’s say the same user visited your site three times during a month. That would count as one user and three sessions in your web analytics data.
Here we see data from Google Analytics for the Google Merchandise Store demo account showing 66,342 unique users accounting for 94,465 total sessions.

Your traffic trend over time can be a useful indicator of site health, brand health, and overall top-of-the-funnel performance.
Traffic Sources
Traffic source is a dimension you can use to dive deeper into your web traffic metrics like session count and user count.
Below, you see the same user and session data that we saw in the preceding section. But now the data is broken down by the “Session default channel group” dimension (“channel group” is a way of organizing traffic sources in Google Analytics).
And you can see that 25 users arrived at the site in the specified time frame via links from unpaid video sites like TikTok and YouTube.
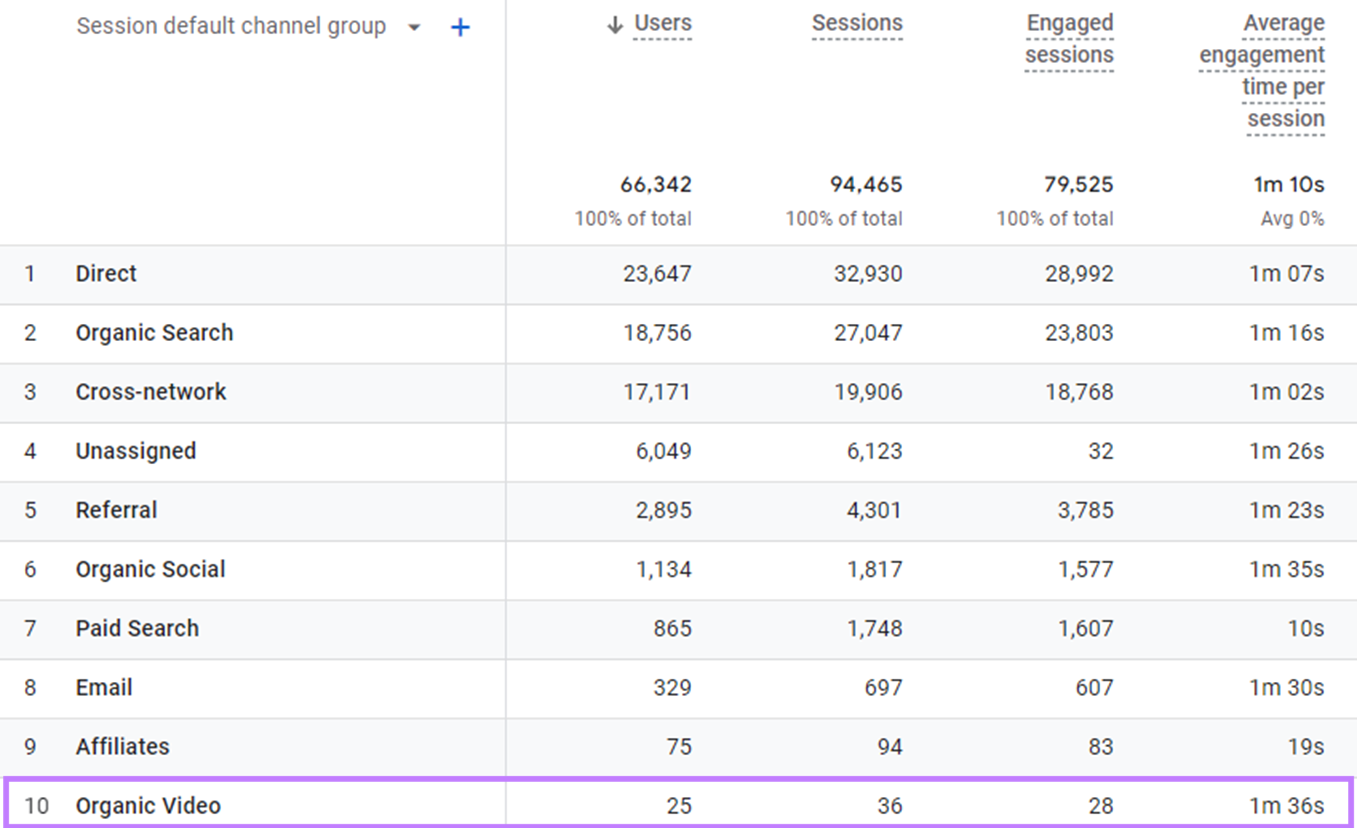
With the help of this traffic dimension, you can prioritize your top performers and identify potential new opportunities from bottom performers.
For example, the Google Merchandise Store might have an opportunity to invest in their organic video channel. It only drives a small portion of total traffic, but the average engagement time per user is higher than anything else on the screen.
Views
With the help of web analytics, you can analyze views to learn more about your most popular content.
Let’s consider page-level detail from Google Analytics. Which can help guide content and design decisions.
For example, the /Google+Redesign/Stationery page generates a lot of interest (24,943 page views) but little engagement. The site merchandising team might compare that page against the /Google+Redesign/Apparel/Mens page (which has a much higher average engagement time) to see if there are improvements to be made.

How to Leverage Website Analytics
Analytics can help to power real business growth when used properly within the framework of an overall plan.
Let’s say you run an online store. Here’s how you might use website analytics in your business.
Establish Business Goals and Website KPIs
Before looking into your data, identify your business goals and the specific key performance indicators (KPIs)—specific metrics you use to track progress toward your overall goals—that will help you accomplish your goals.
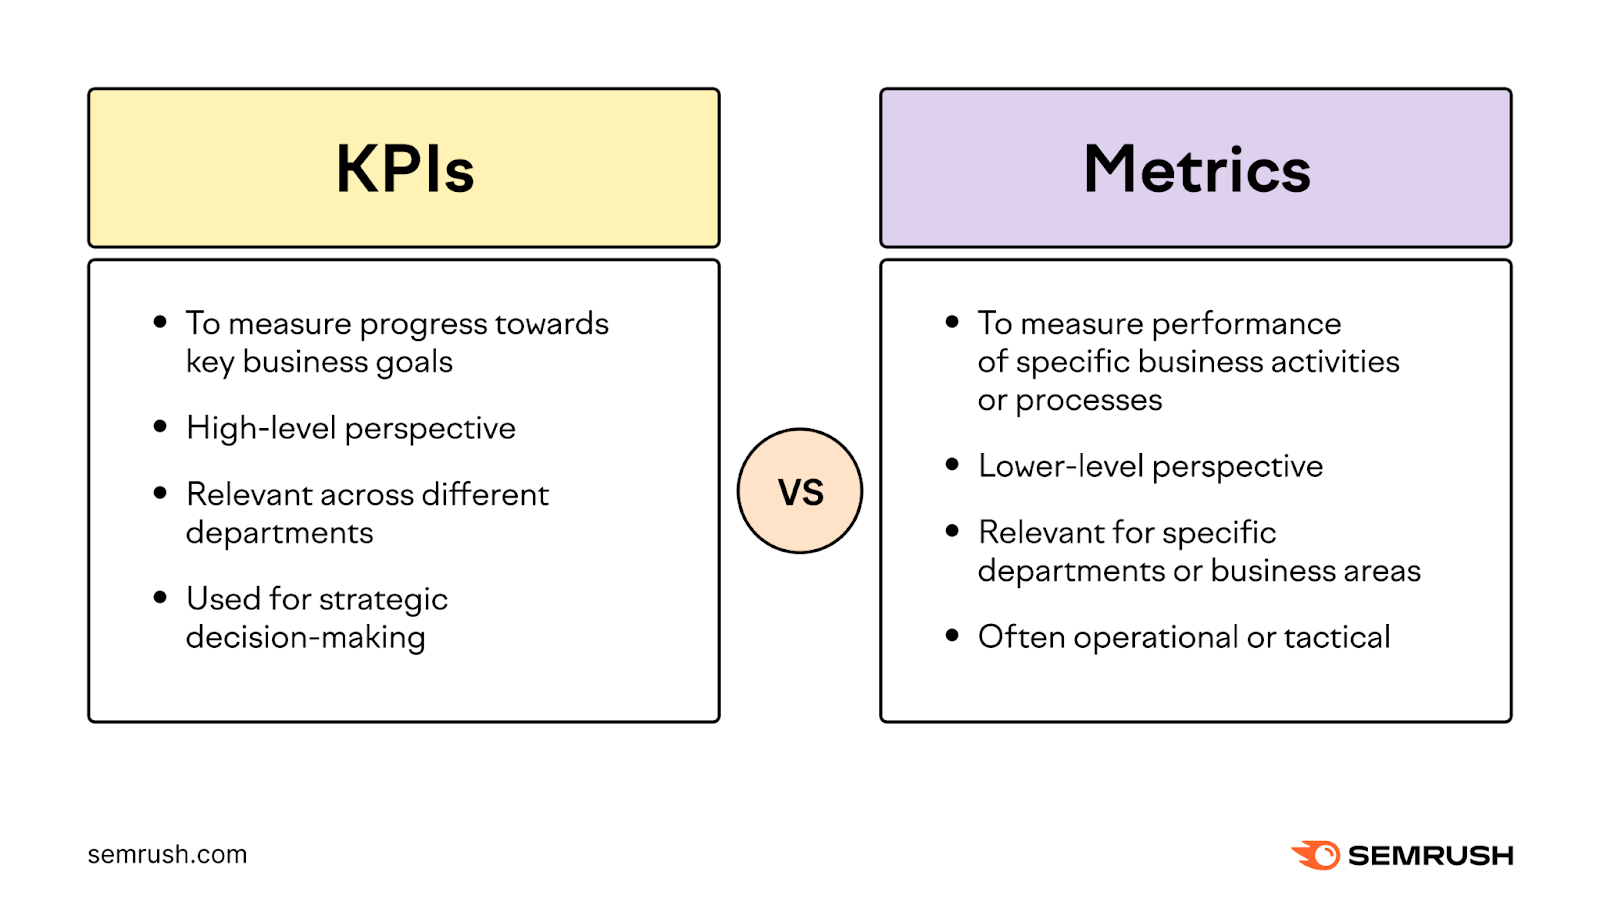
Let’s say your goal is to generate $500,000 in revenue through your online store in the year ahead. So, your KPIs should be narrowly focused on the metrics that will help you reach that goal.
One of your two KPIs is to achieve an ecommerce conversion rate of 2.5%. Meaning that out of every 100 sessions, your site will generate 2.5 purchases on average.
You’re confident that you’ll be able to reach it because it’s in line with your industry average and your own site’s historical performance.
Your annual traffic forecast is 160,000 sessions. If you continue that trend and achieve your 2.5% conversion rate KPI, your site will generate 4,000 purchases during the year.
Your other KPI is to reach an average purchase amount (or average “basket size”) of $125. This is a slight increase over your historical averages, but you feel confident. Because you have a new website feature that recommends complementary products to customers and a new puzzle set that you believe some of your customers will be willing to add to their baskets.
If you can achieve your $125 average basket and your 2.5% ecommerce conversion rate, you know you’ll reach your annual sales target of $500,000.
Collect Data
Once you define your goals and KPIs, you need the proper tracking tool to collect the data you need.
You decide to use Google Analytics since it can collect this data for you. Which it does through a tracking code that gets installed on your website.
Here’s the tracking code that you need to set up Google Analytics. (Google Analytics tracking codes are the same except for the unique measurement ID that tracks your website.)

Your Google Analytics property begins collecting data once the code is properly installed.
You’re very interested in your total website traffic, your purchase conversions, and your total revenue.
When you look at your number of purchases and overall purchase revenue after two months, you see you’re ahead of schedule. You’ve already generated $115,489.67 in sales through 20.8% of the year. With your monthly sales relatively evenly distributed throughout the year, you’re forecasting to achieve annual sales of $554,347 ($115,489.67 / 20.8%)!
And you can see that your average basket is driving performance. It’s $160.62 ($115.489.67 in total revenue / 719 purchases)—well above your $125 goal.

You’re happy about the positive sales trend, but you don’t yet understand why the results are so good. For that, you need to dig deeper into your data.
Analyze Data
You can move beyond top-level numbers to uncover useful insights by analyzing your data.
With analysis you move past “what happened” to thinking about “how” and “why” it happened. And make hypotheses about why you see certain behaviors, which allows you to understand your audience in a deeper way.
In your case, you know that your sales are trending above your annual goal and that your average basket size is helping. But you don’t yet know what’s causing that until you dig deeper into your product sales data.
You use Google Analytics to review the specific items that are performing well in your online store and you immediately see a big reason why performance has been so strong—the new puzzle set is even more popular than you predicted.
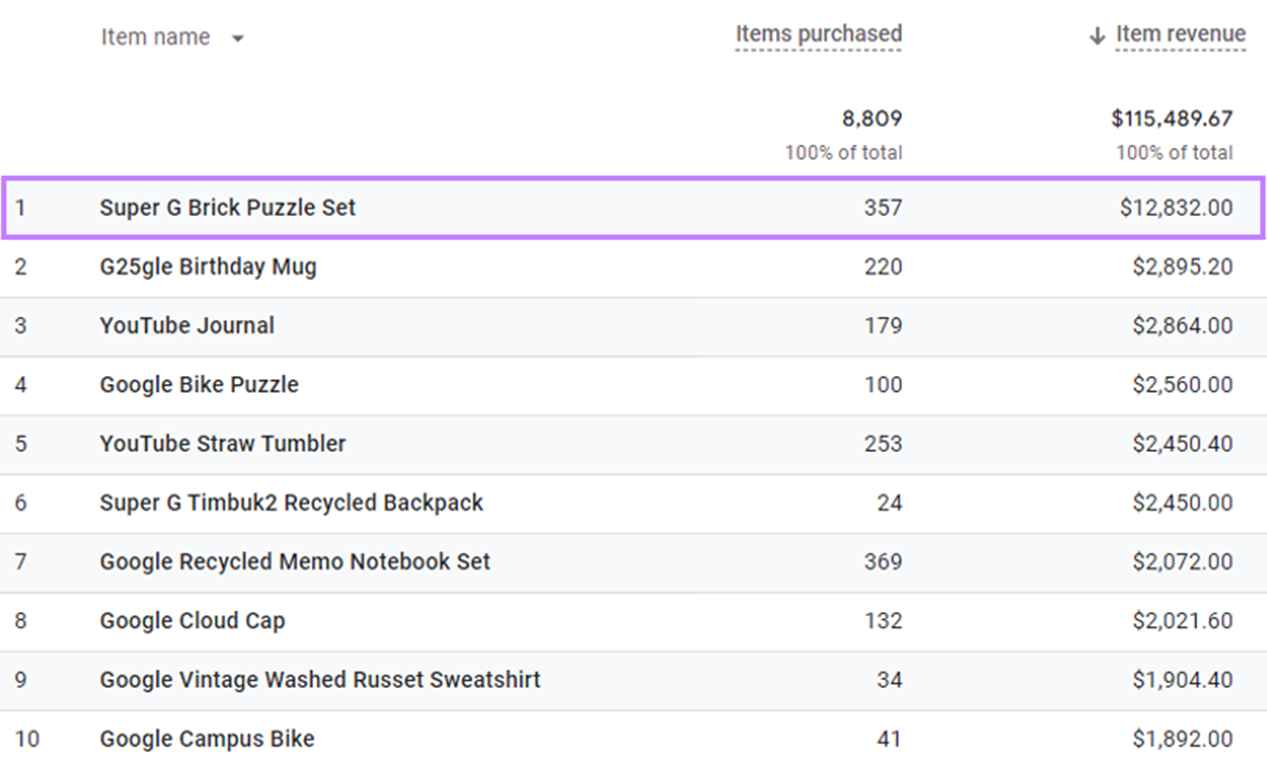
In fact, you can see from your Google Analytics data that it has generated roughly five times more revenue than the next highest item. You had only planned to sell 200 units for your entire year but have already sold 357 through the first two months.
Many of your customers have been electing to add this item to their existing baskets through the automated cross-sell tool you had added to your site.
Now, let’s go over what you can do to leverage that insight to improve your performance even more.
Make Decisions to Improve Performance
After analysis, you can make data-informed decisions to improve performance.
You’ve uncovered a surprisingly strong seller that has been performing well despite not getting much marketing support or prominent placement on your site. The performance has been entirely driven by your website tool that recommends products to your customers who have already added something to their carts.
You decide to do two things. First, you’re going to capitalize on the trending puzzle set by adding it to your email and social media marketing calendars. And by featuring it prominently on your homepage.
Secondly, you arrange a meeting with your merchandise buying team to brainstorm other new product ideas that also might perform as complementary products. You know you aren’t guaranteed to replicate the sales boom of the puzzle set, but you have data now that shows what kind of success if possible.
You’ll be ready to make data-informed decisions like this after you’ve established your goals, implemented your web analytics tracking system, and analyzed your resulting data.
Website Analytics Tools to Know
Let’s review four of the most well-regarded tools and consider who should use them.
For even more tool comparisons, check out these 15 Google Analytics alternatives.
Semrush
Semrush is a comprehensive tool suite that integrates with other analytics platforms like Google Analytics and Google Search Console to generate actionable insights.
Who Uses Semrush
Semrush is great for those who have questions about their site health, keyword rankings, traffic trends, and how it all connects to overall performance.
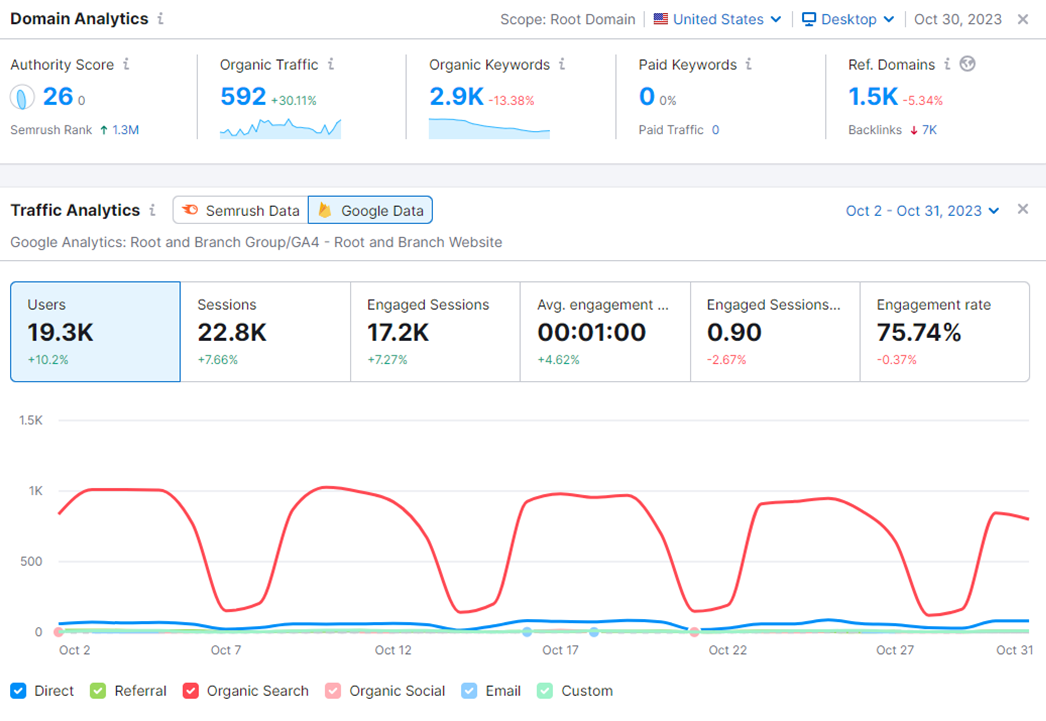
Here’s a snapshot of what you can see within the SEO Dashboard:
Google Analytics
Google Analytics is installed on your website using a JavaScript tracking code. The software collects data as users interact with your site.
Who Uses Google Analytics
Google Analytics is beneficial for anyone who has questions about where their visitors come from and what they do on their site. Or those who want to create and share reports about what’s happening.

Piwik PRO
Piwik PRO is installed on your website using a JavaScript tracking code. The software collects web interaction data as your users interact with your site.
Who Uses Piwik PRO
Piwik PRO is a good choice for people interested in the type of data that Google Analytics can provide but who have serious data privacy concerns.

Microsoft Clarity
Microsoft Clarity is installed on your website using a JavaScript tracking code. The software collects user experience data as your users interact with your site.
Who Uses Microsoft Clarity
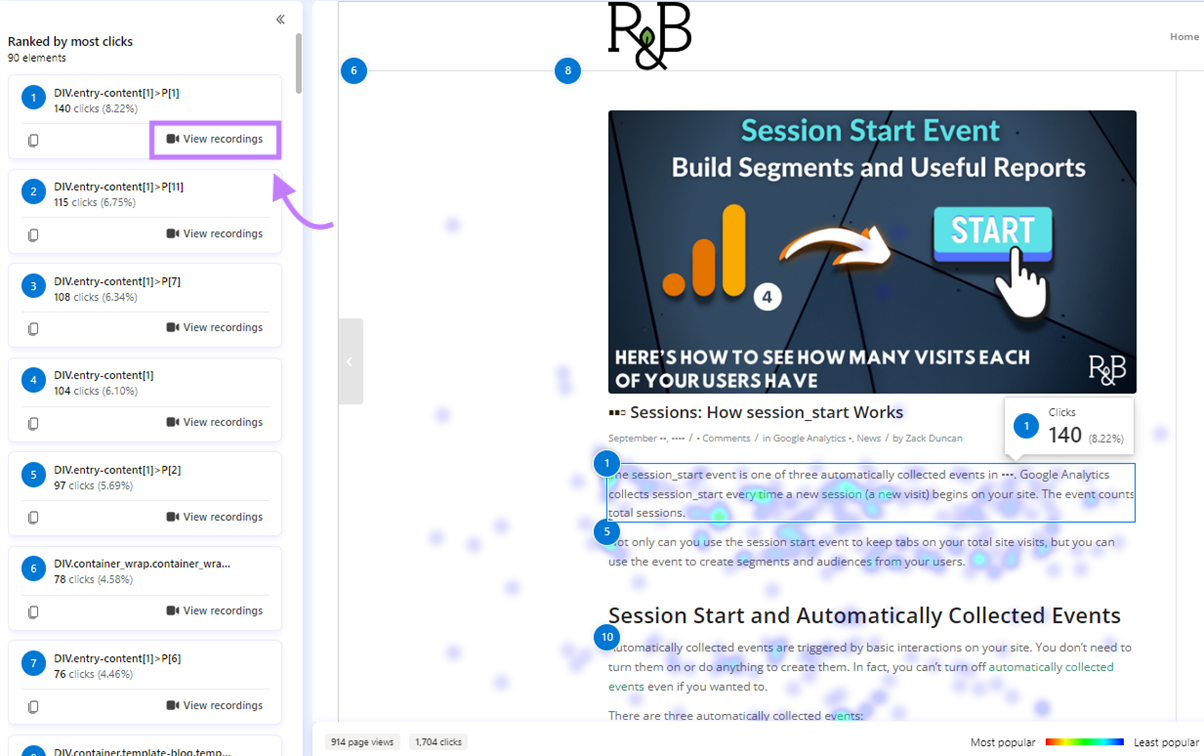
This tool is a good choice for companies that want to see click and scroll heatmaps, view session recordings, and identify situations where their web visitors seem frustrated.
In the screenshot below, you see a heatmap identifying the most clicked sections on a page. And you can filter to watch session recordings using the “View recordings” buttons to the left.
Merging Tools to Find Performance Improvement Opportunities
If you want digital analytics to be more than just reporting data, you’ll need to make decisions that can improve your performance.
One way to do that is to use Google Analytics and Semrush together.
Let’s say you run a B2B website and you use your blog pages to drive new leads for your sales team. You collect your leads through a form submission that you record as a conversion.
The first step is to identify which pages to work on to drive more of those conversions. Let’s see how to use Google Analytics data with Semrush for that.
Identify Target Pages for Improvement
You want a quick and easy way to evaluate the performance of your top pages and identify areas for improvement.
You can use Organic Traffic Insights in Semrush. It combines your Google Analytics engagement rate data along with additional data about conversion count and keyword data from Google Search Console and Semrush.
Here’s what you see:

You quickly spot a page that drives a lot of conversions but is declining in traffic. You know that if you can turn around the declining traffic, you could expect even more conversions.
Using Semrush to Power Organic Traffic
You’ve spotted a major opportunity on a blog post that’s seen a 39% drop in users who come from organic search.
You know your competitors write about similar topics, and your research confirms that two competitors have recently published blog posts on the same subject as this landing page.
You determine that you’ll need to target additional keywords within your page to give it more ranking opportunities.
You can find keyword opportunities in Semrush.
Here’s how.
First, you click on the 65 keywords linked in Organic Traffic Insights to see what keyword opportunities you may have on the page.

You spot an opportunity in the eight row on the keyword list.
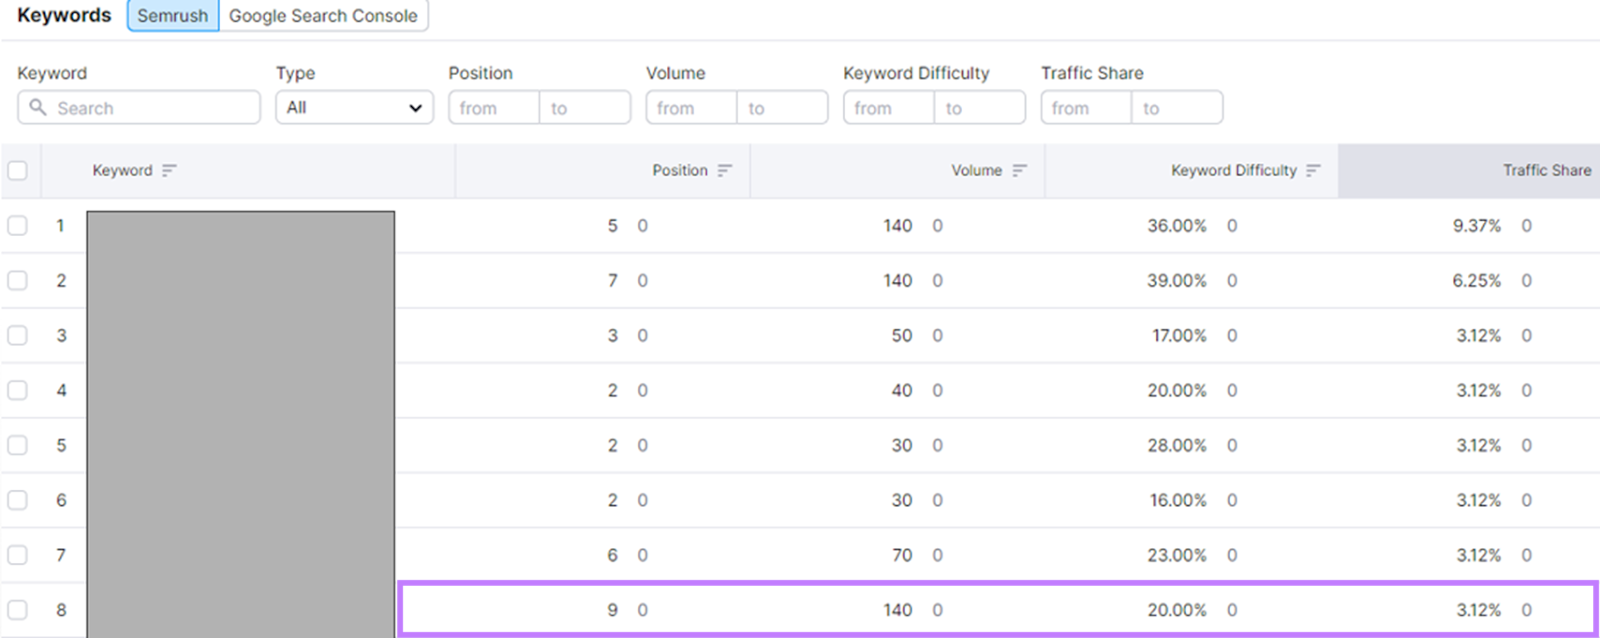
It’s a relatively high-volume keyword with a low difficulty score. So, you work with your content team to create a new H2 on the page focused on this keyword.
You also use the Keyword Magic Tool to see if there are additional keyword ideas your team should target. By entering a seed term to uncover new keyword opportunities.
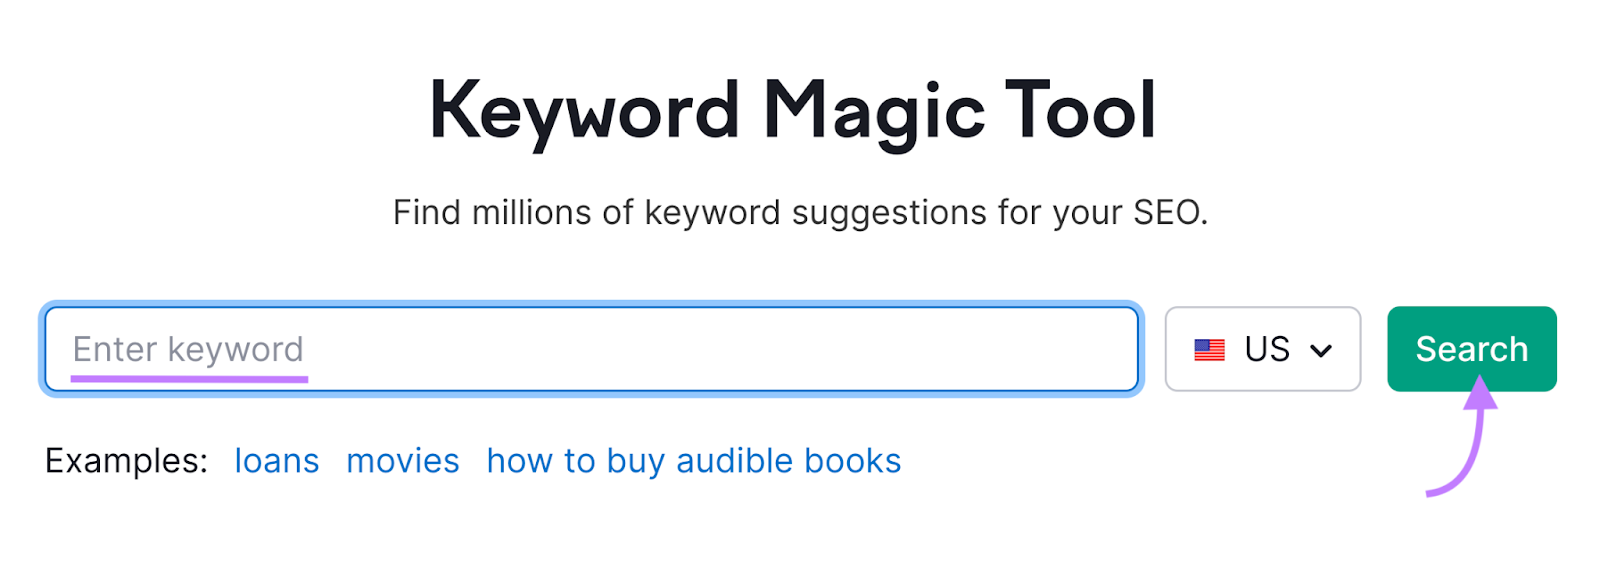
As you expand your blog post by adding additional H2s targeting relevant keywords, you give your page additional opportunities to rank and drive traffic. So, you’re on your way to turning around your declining traffic and boosting your conversions.
Get Started with Web Analytics
Web analytics is far more than collecting data and sharing reports. It’s an ongoing process—and a commitment to making data-informed decisions.
Marketers who embrace analytics tools and an analytical mindset can uncover new insights and opportunities to help power business results.
Ready to try out Semrush to generate your analytics insights? Start your free trial today.
