
What Is Google PageSpeed Insights?
Google’s PageSpeed Insights (PSI) is a free tool that analyzes the performance of your webpages on mobile and desktop devices. And offers valuable metrics (known as the Core Web Vitals) to assess the quality of the user experience.
The tool gives you a score between 0 and 100. A higher score usually means your page is optimized for speed and efficiency.
PSI uses Lighthouse (an open-source, automated tool) to analyze webpages’ performance and quality. And provides a performance report with improvement suggestions based on two types of data:
- Lab data: This is data collected by Lighthouse in a controlled environment. It helps you debug issues by simulating how your site loads but might not show real-world user experience issues.
- Field data: This is real-world user experience data gathered from actual users as they interact with your site. It provides a realistic view of the user experience but includes fewer metrics.
What Is a Good PageSpeed Insights Score?
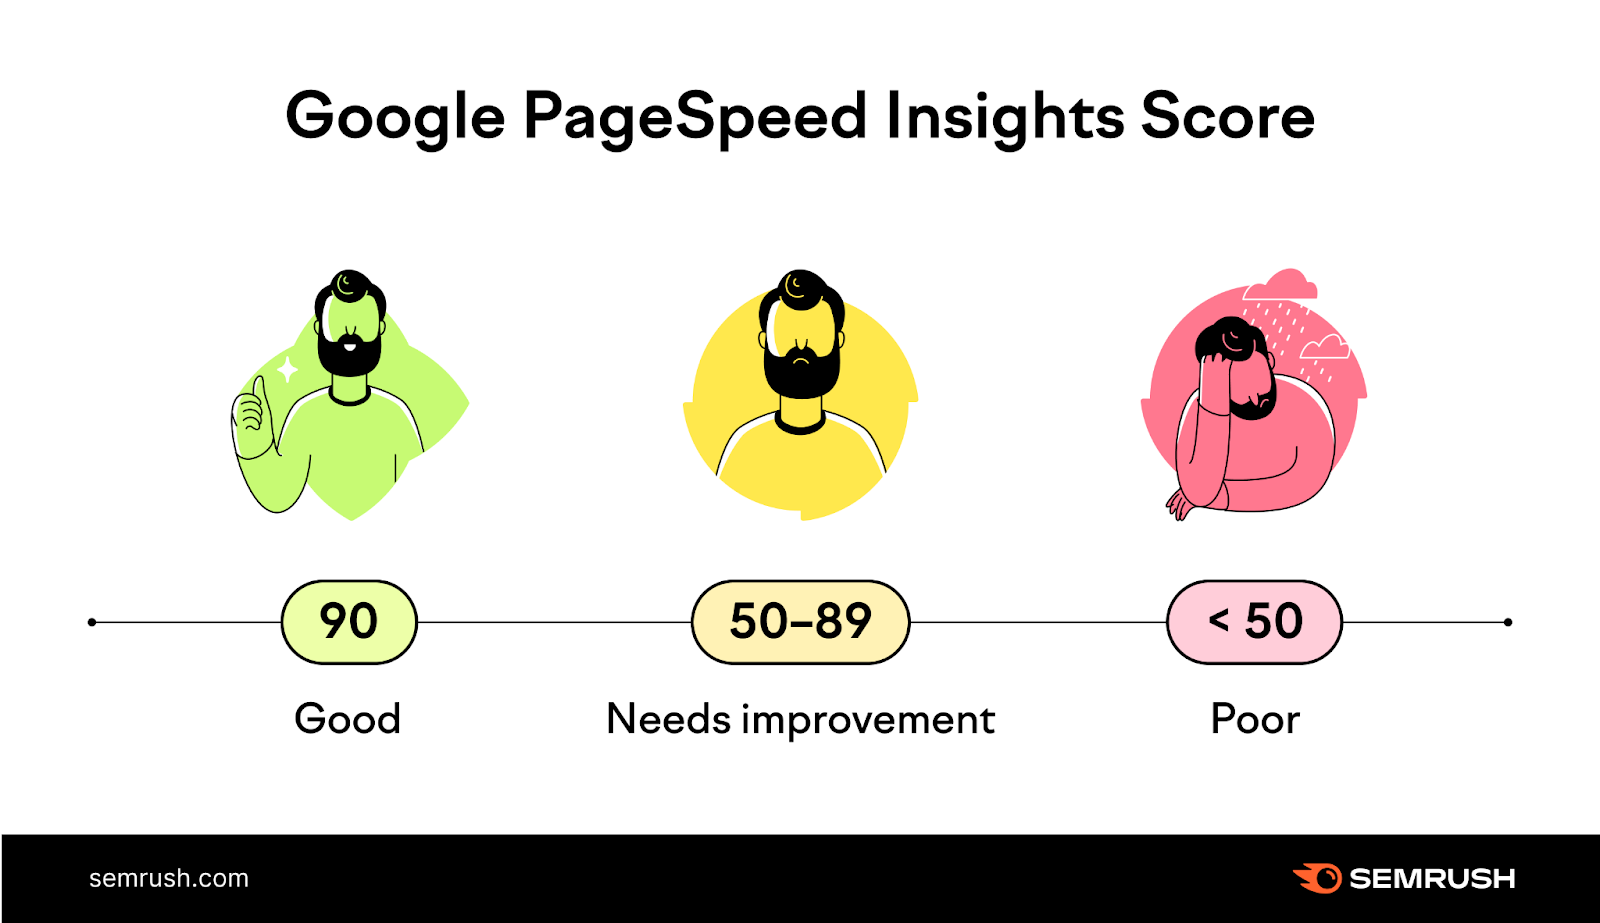
A score of 90 or above is good, 50 to 89 needs improvement, and below 50 is considered poor, according to Google.
If your score is below 90 across many pages, it’s possible your users aren’t having a good experience. And there may be some negative SEO effects as well.
But there’s no point in obsessing over a perfect score of 100—especially on every page. Because visitors ultimately care about quickly finding information (or a solution). Not your score.
How Does Your PageSpeed Insights Score Affect SEO?
Google isn’t running your site through PSI and using it to rank you. But that score is partially based on page speed—a confirmed Google ranking factor.
Slow loading times frustrate users and lead them to abandon your site. But visitors are more likely to stay and engage with your site if pages load quickly.
This leads to a better user experience. And search engines reward sites that provide a great page experience to visitors.
So, improving your PSI score is likely to have a positive impact on your search rankings.
How to Use the Google PageSpeed Insights Tool
PageSpeed Insights is pretty easy to use.
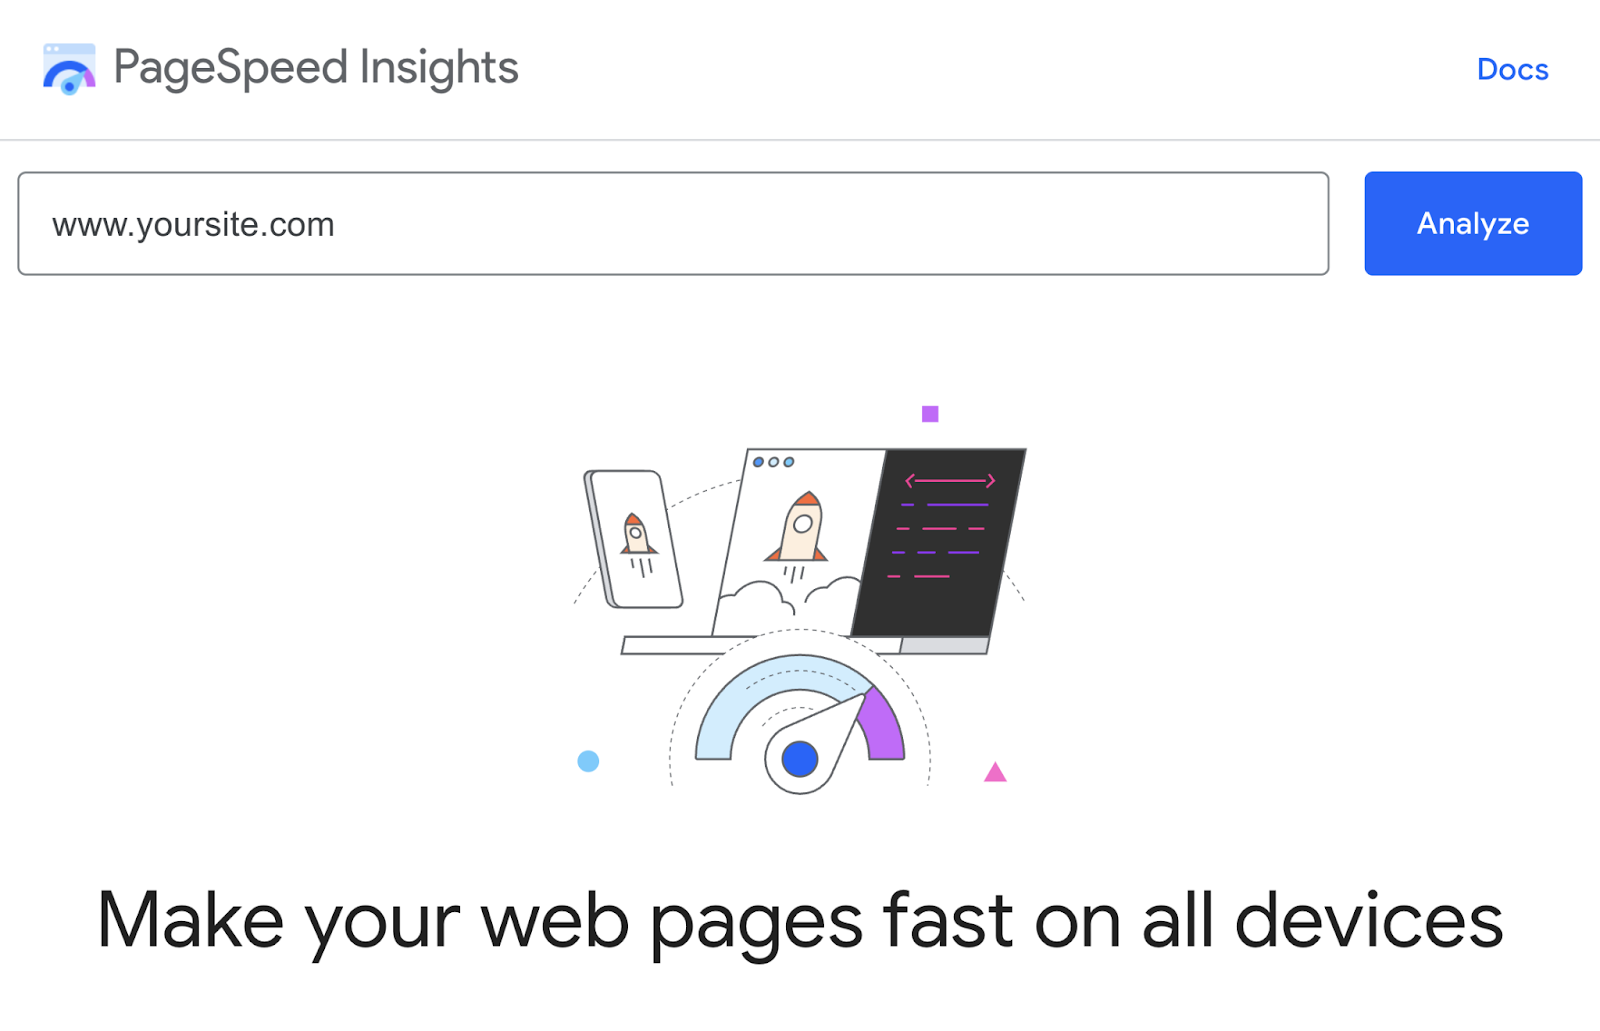
Just go to PageSpeed Insights, enter any URL (whether it’s your own or a competitor’s), and click “Analyze.”
Then, wait for the tool to analyze the webpage. This may take a few seconds to a minute, depending on the complexity of the page and your internet connection speed.
At the top of the report, you’ll see whether your site passed or failed the Core Web Vitals Assessment. Like this:

The Core Web Vitals are a group of metrics that measure a website’s (or a page’s) user-friendliness. Based on load times, interactivity, and visual stability.
It includes these three metrics:
- Largest Contentful Paint (LCP): Measures loading performance, specifically the time it takes for the largest content element of the page to become visible to the user
- Interaction to Next Paint (INP): Measures responsiveness, specifically how quickly (or slow) a page responds to user interactions
- Cumulative Layout Shift (CLS): Measures visual stability, specifically how much the page content moves around as it loads
Other notable metrics include:
- First Contentful Paint (FCP): Measures the time a page takes to display the first content element
- First Input Delay (FID): Measures interactivity, specifically the time it takes for the website to respond to the first user interaction, such as clicking a button or a link. (Previously FID was one of the three Core Web Vitals. INP replaced it in March 2024)
- Time to First Byte (TTFB): Measures the responsiveness of a web server, specifically the time it takes for a browser to receive the first byte of data from the server. After a user requests a web page.
Next, you’ll see a performance score in the section titled “Diagnose performance issues.”
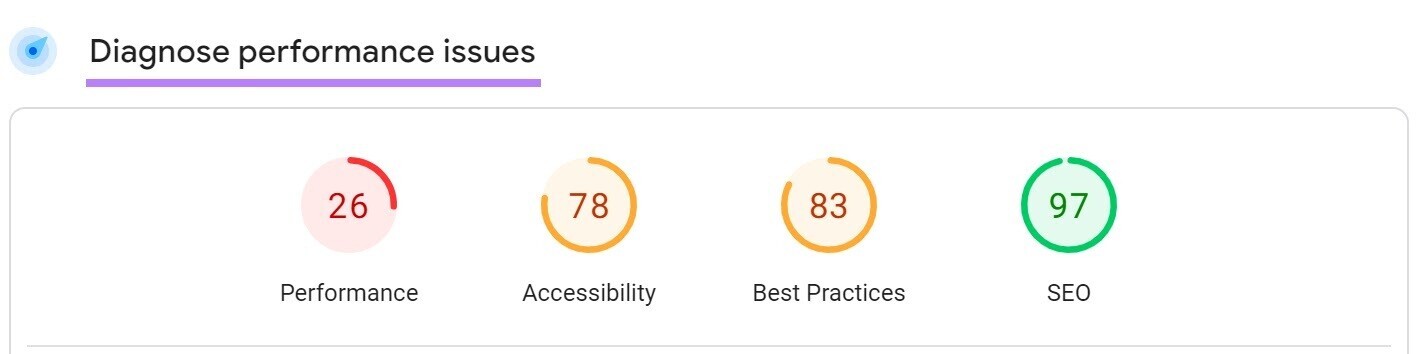
Google PageSpeed Insights gives your page a score for each of the following categories:
- Performance: This is a weighted average of the scores of First Contentful Paint (FCP), Speed Index, Total Blocking Time (TBT), Largest Contentful Paint (LCP), and Cumulative Layout Shift (CLS). It indicates how well your page performs in terms of speed and optimization.
- Accessibility: This category assesses factors such as ease of navigation, alt text for images, and color contrast for users with visual impairments.
- Best Practices: This category measures how well your page adheres to web development best practices. From using modern web technologies, optimized code, and secure connections, to including essential meta tags and managing JavaScript effectively
- SEO (Search Engine Optimization): This category focuses on how well your page is optimized for search engines, considering aspects such as metadata, structured data, and mobile-friendliness.
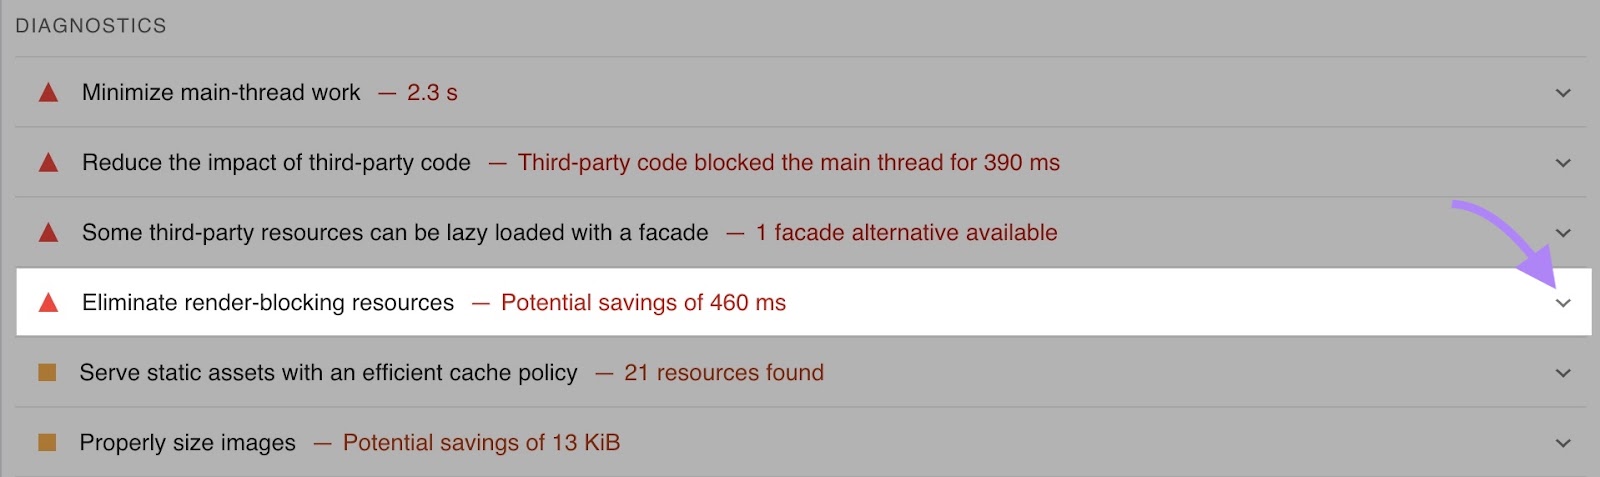
As you scroll down, you’ll find a list of items called “Diagnostics.”
These are Google’s recommendations for improving your site. That could be optimizing images, simplifying code, or reducing server response time.
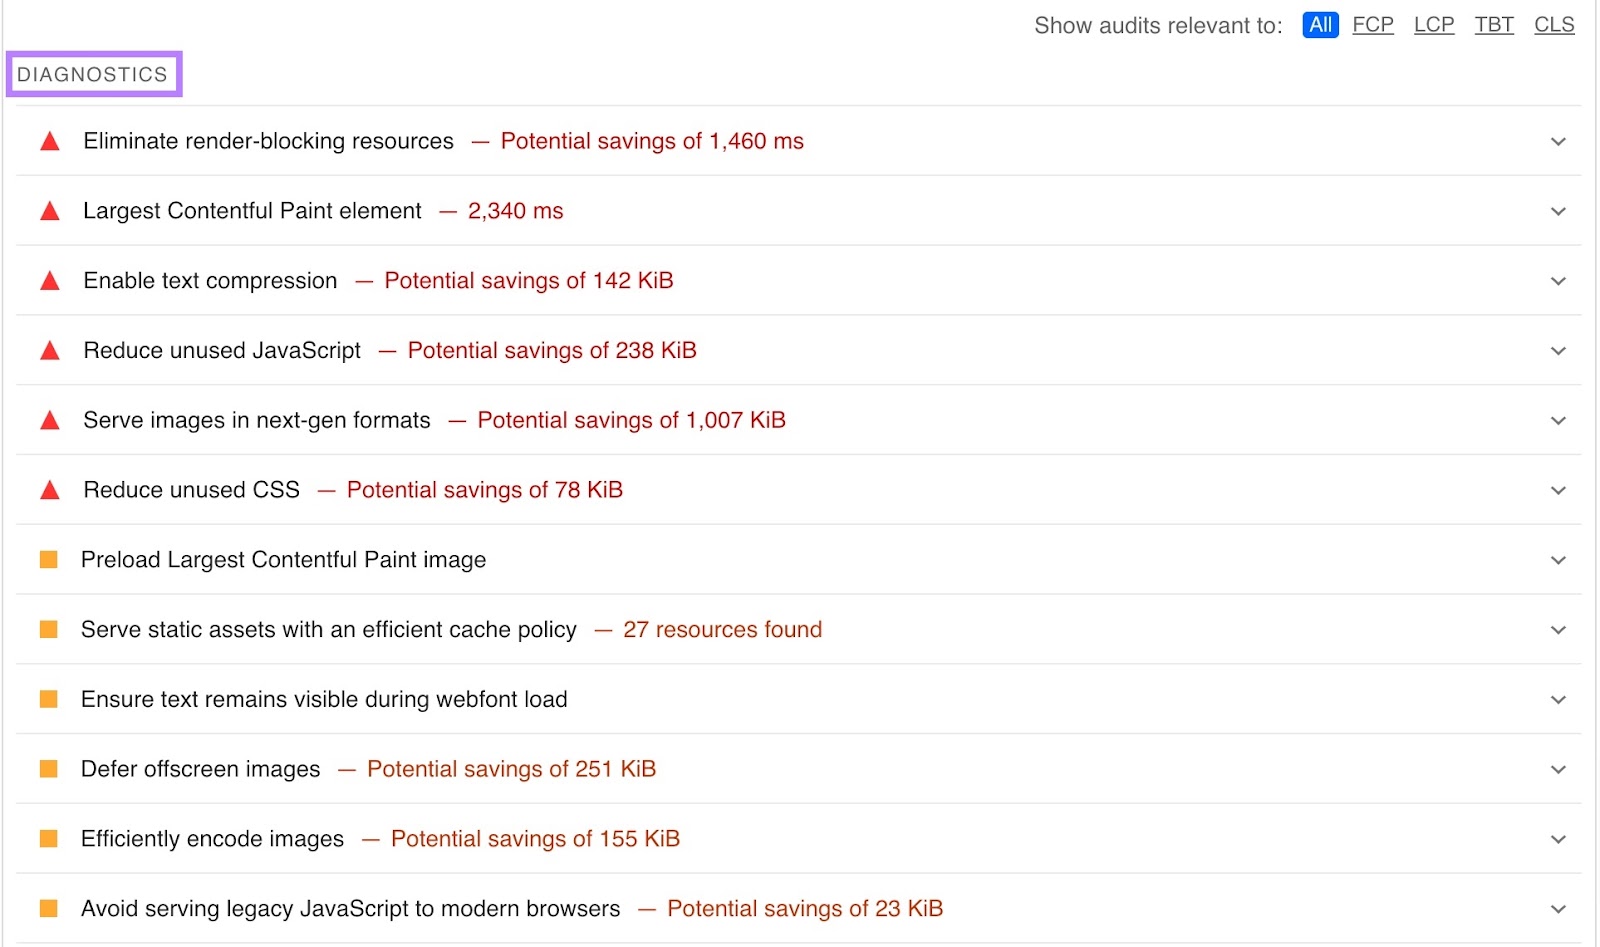
This section lists the performance audits that your site didn’t pass, along with the potential savings if the issues are fixed.
You can click through each item to dive deeper into what’s causing the issue. And how to fix it.
After you implement the suggestions, rerun the analysis to see if the page’s performance has improved. And consider running the analysis twice at different times of the day because you can sometimes get a different score even without making changes.
How to Check Speed Across Your Entire Site
To get a fuller picture of how fast your entire site is, use Google PageSpeed Insights along with Semrush’s Site Audit tool. Which measures your website’s speed and gives deep insights into the factors affecting it.
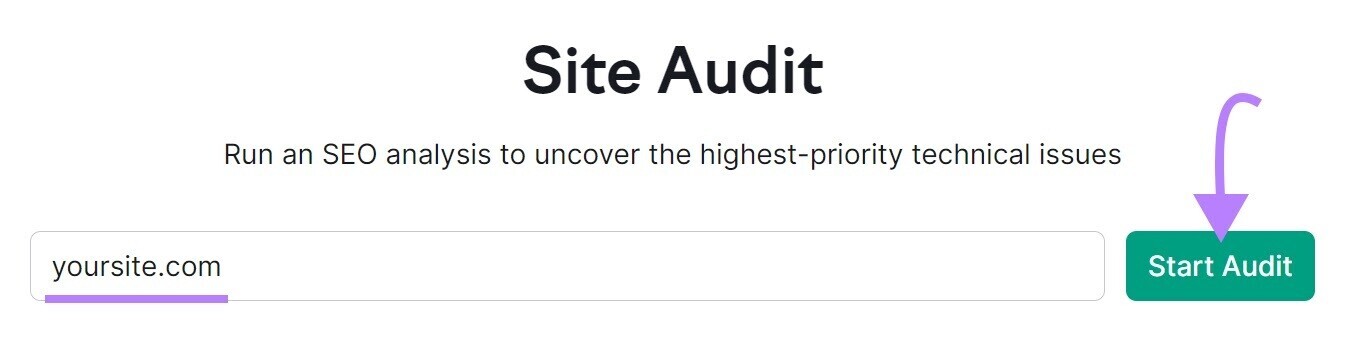
Open the tool, enter your domain, and click “Start Audit.”
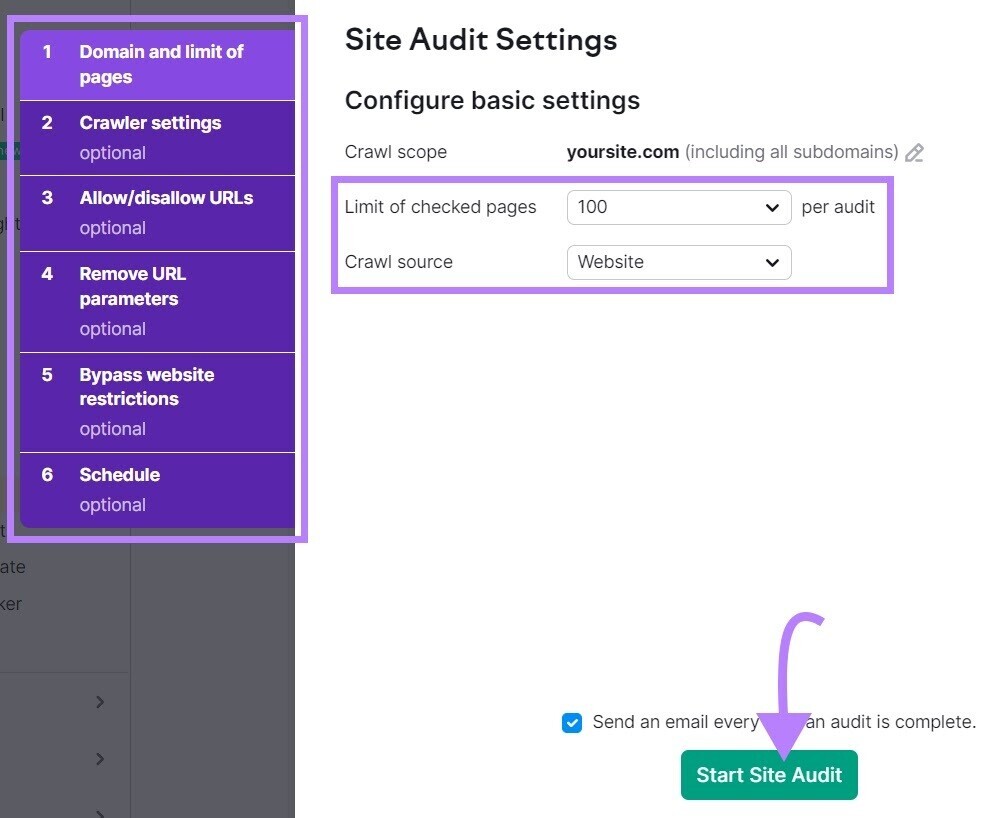
Next, follow the configuration instructions and click “Start Site Audit.”
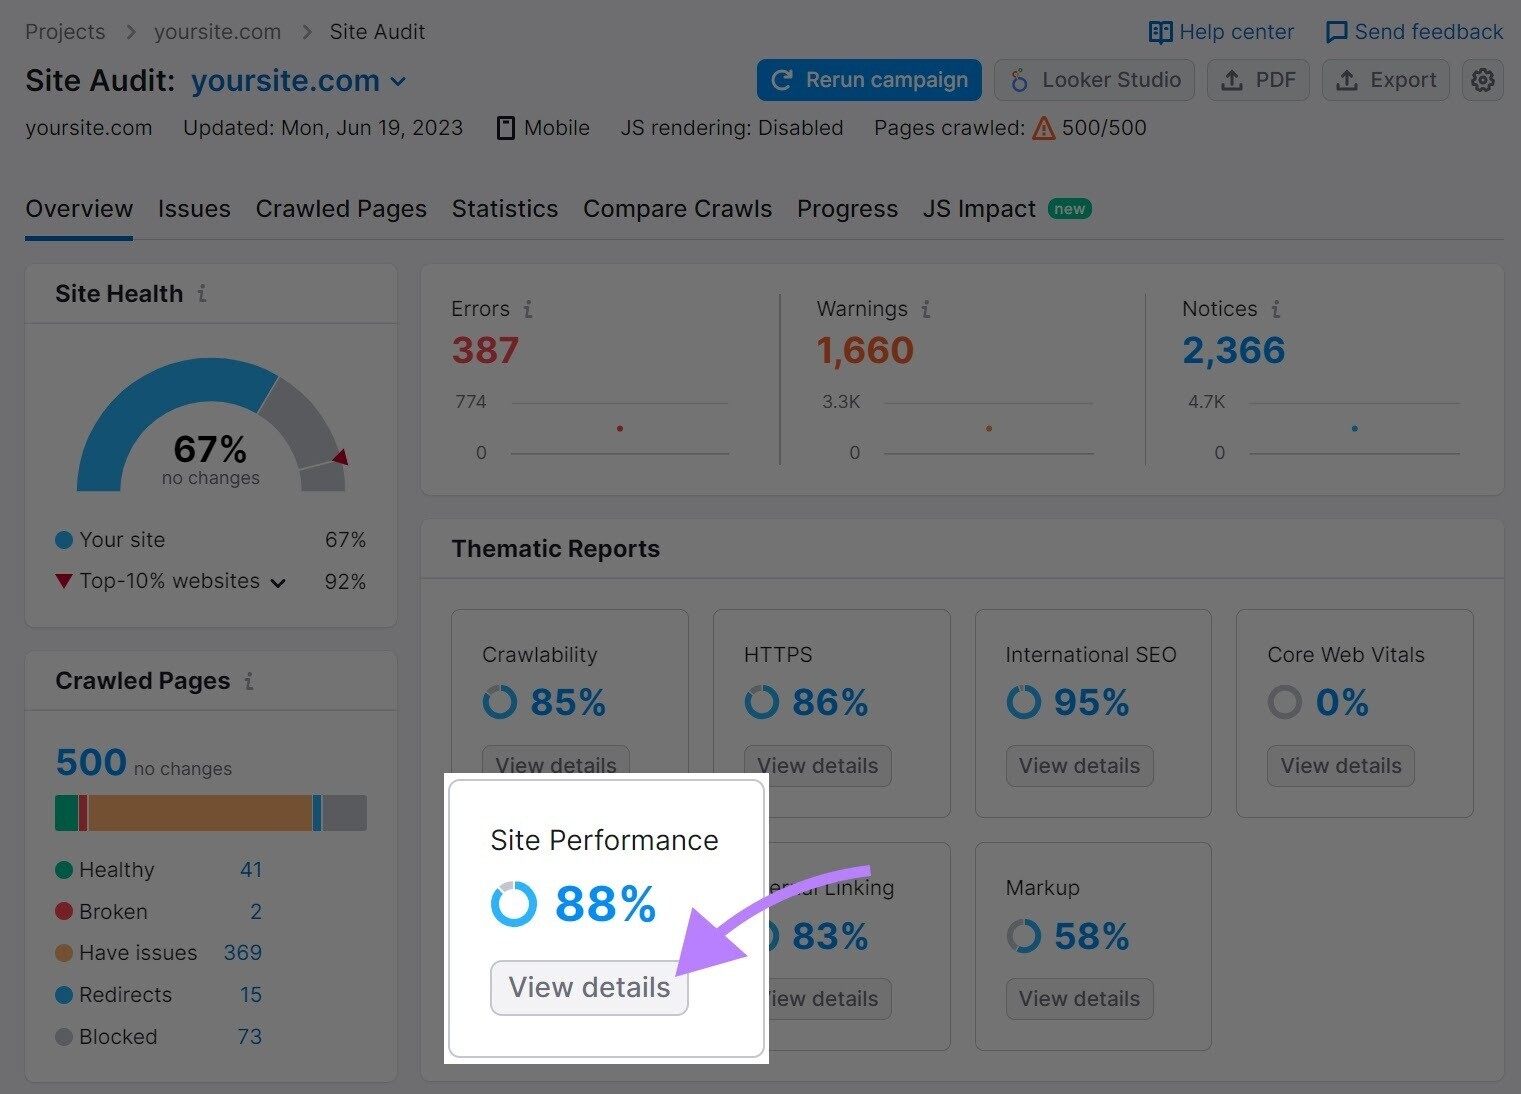
You’ll see a dashboard like this one.
Next, click “View details” under “Site Performance”.
Within the “Site Performance” report, you’ll see your average page load speed in seconds.
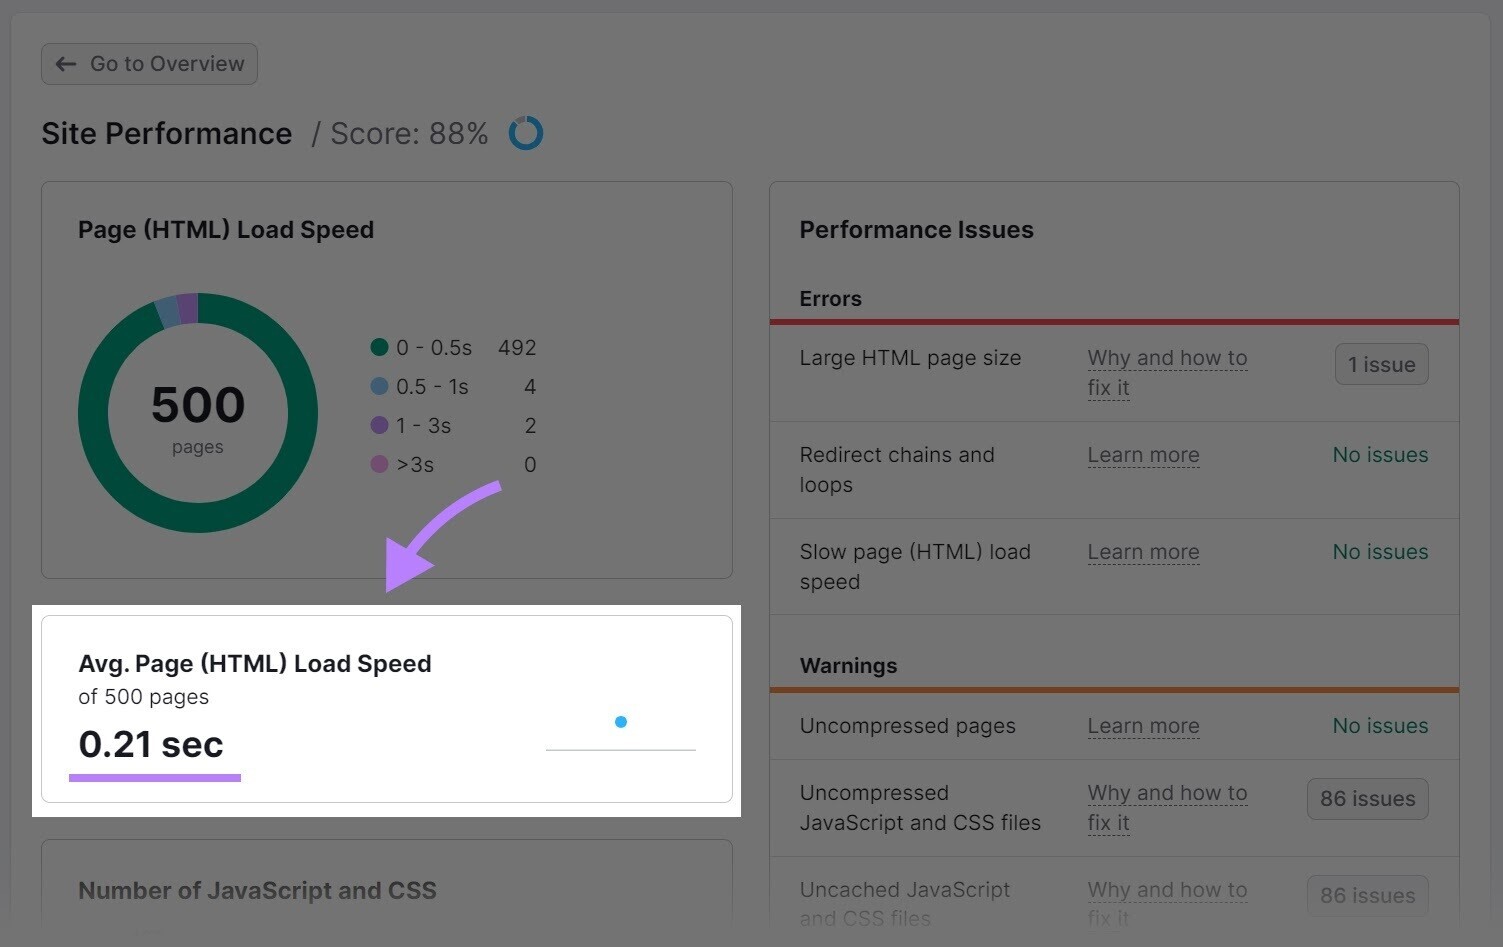
You’ll also see a list of “Performance Issues” you can address to improve speed across your website.
How to Improve Your Google PageSpeed Insights Score
To improve your PSI score, you can follow the recommendations from your PageSpeed Insights report as well as your Site Performance report in Site Audit.
Some suggestions may be easy to implement yourself (e.g., resizing images). Others may require the expertise of a web developer and/or a technical SEO specialist (e.g., reducing unused JavaScript).
That said, here's a step-by-step guide to implementing some of Google's most common PageSpeed Insights (PSI) suggestions to boost your score.
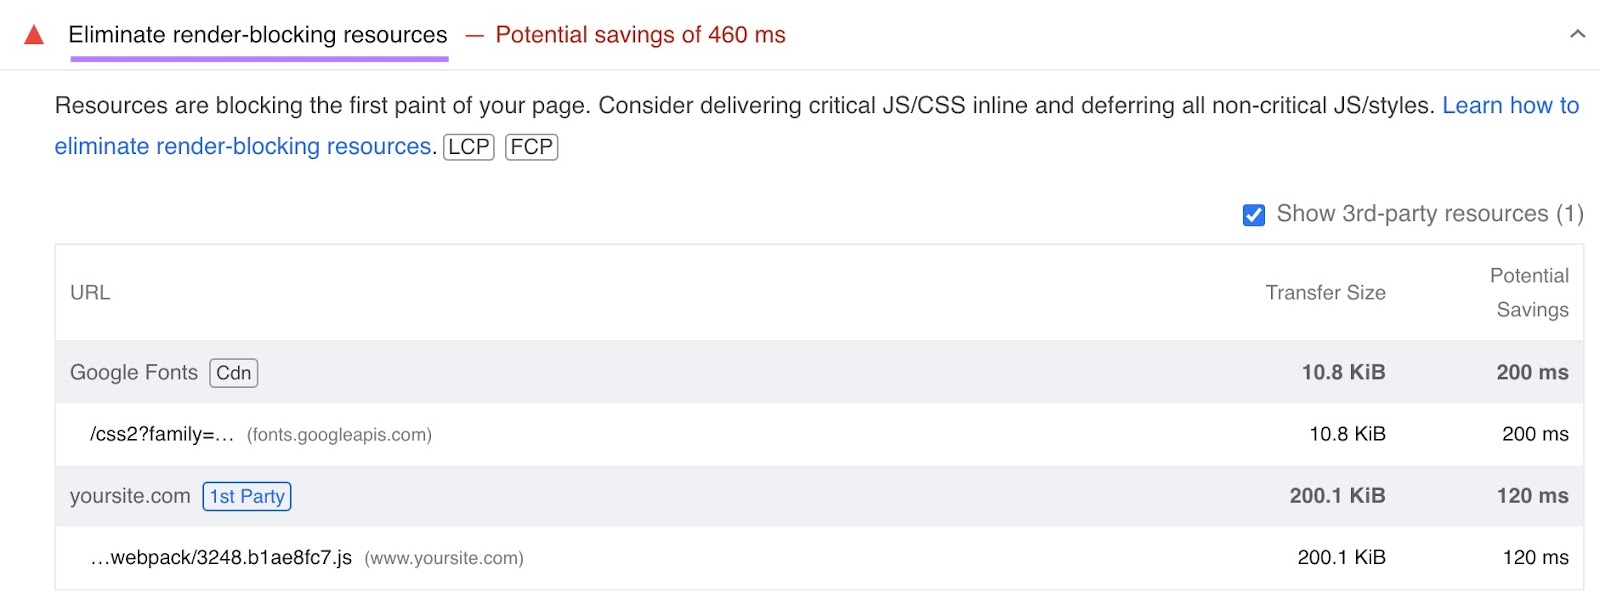
1. Eliminate Render-Blocking Resources
Render-blocking resources prevent a webpage from loading quickly. This is because resources such as CSS, JavaScript, and font files force the browser to load them before displaying the page.
Getting rid of these roadblocks can make your page load faster and improve your Google webpage speed test score.
To do that, follow these steps:
- Look for "Eliminate render-blocking resources" in the "Diagnostics" section of your PSI report.
- Click on the arrow next to the suggestion to see the list of resources that are causing the issue. Which will show you which resources are blocking the page from rendering quickly—and the potential time savings in milliseconds.
- Once you’ve identified the render-blocking resources, the next step is to figure out which ones aren’t essential for the functionality of the website so they can be removed, inlined, or deferred.
If you’re not familiar with coding or website development, you are likely to need developer support for this step.
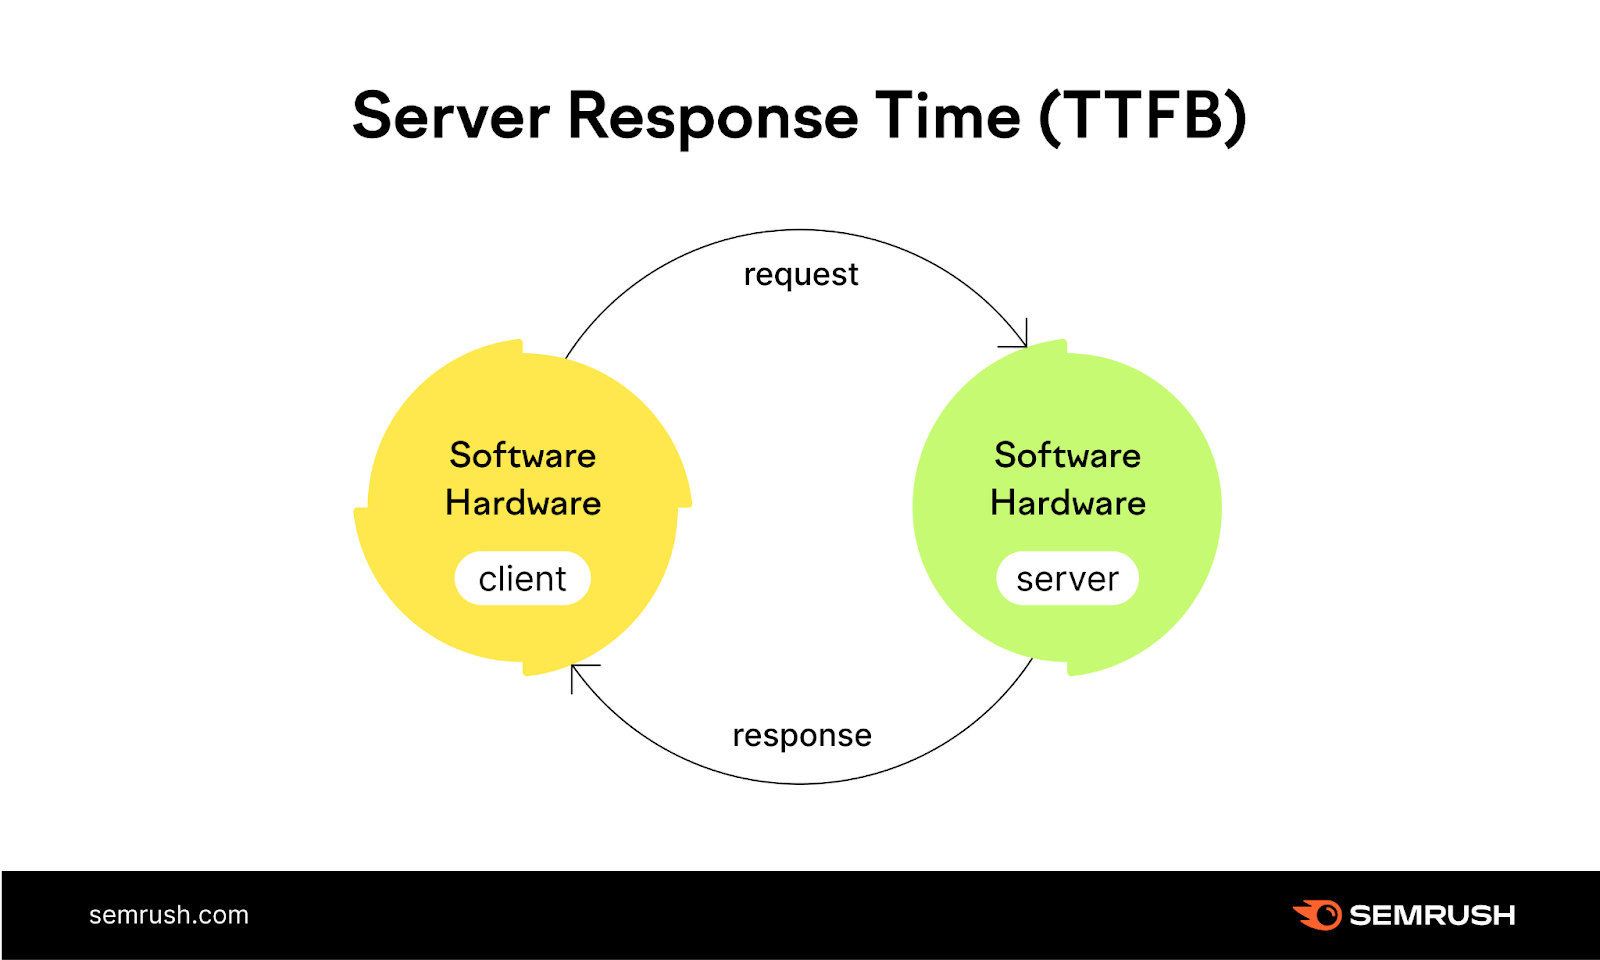
2. Reduce Server Response Times
The server response time, also known as time to first byte (TTFB), is the time it takes for the browser to receive the first byte of data from the server. A slow TTFB can negatively impact page load speed, as it delays the time it takes for the browser to receive the page’s content.
When a user tries to access a webpage, the browser makes a network request to fetch that content. The server then receives the request and returns the page content.
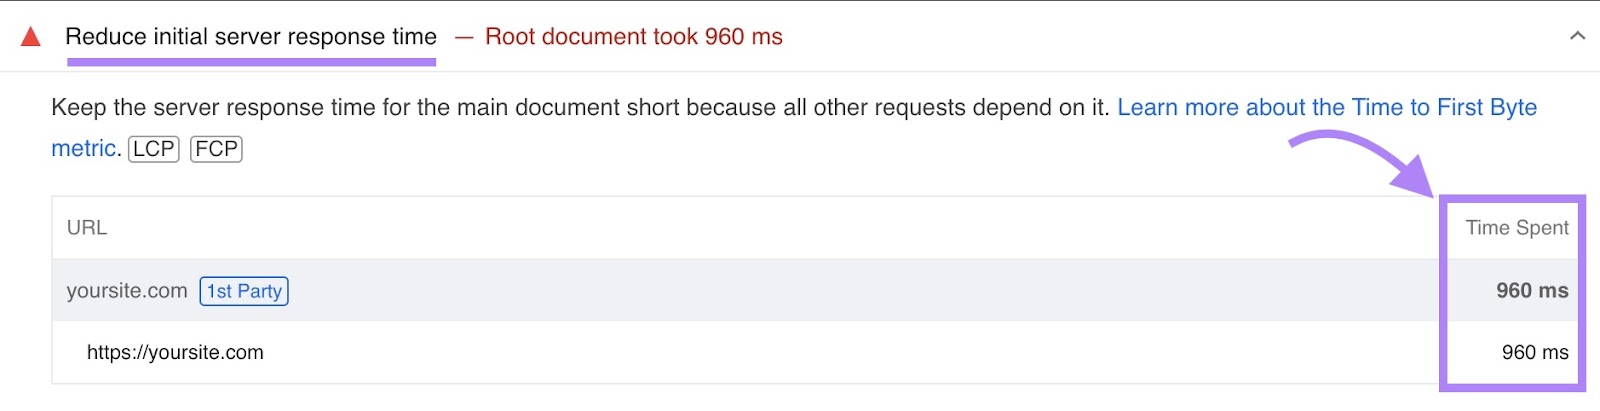
Google PSI will provide the recommendation “Reduce initial server response time” when the browser waits more than 600 milliseconds for the server to respond to the request.
To reduce server response times, you can try the following:
- Choose a web hosting service that offers fast servers and low latency
- Streamline the server’s application logic by optimizing code and removing unnecessary processes to generate pages faster
- Properly index database tables to improve query performance. If needed, consider upgrading to a faster database system.
- Improve server performance by adding more random-access memory (RAM) and upgrading to faster processors. So your server can handle more requests efficiently.
- Use a content delivery network (CDN) to distribute your page’s resources across multiple servers. This reduces the time it takes to deliver those resources to the user.
You’re likely to need support from a developer or your web host for this.
3. Optimize Your Images
Images (especially large ones) can significantly increase page load speed.
The Google site speed test report shows you all images on your page that aren’t appropriately sized and displays the current size and potential savings in kibibytes (KiB).

Resizing these images can save you data and improve the page load time.
There are many ways to optimize your images. And the good news is that it’s relatively simple.
You can:
- Compress your images using a tool like TinyPNG or ShortPixel before uploading them to your website
- Use the appropriate image format (JPEG, PNG, GIF, or WebP) for each image to optimize the file size and maintain image quality
- Use the “srcset” attribute to serve the appropriate image size based on the user’s device
- Lazy-load images using a WordPress plugin like LazyLoad or Smush
If you have a WordPress website, this is fairly simple to do yourself. Here’s how to use TinyPNG to optimize your images:
- Log in to WordPress
- Click “Add Plugin.” Then search for “TinyPNG.” Once you’ve found the plugin, click “Install” and then “Activate.”
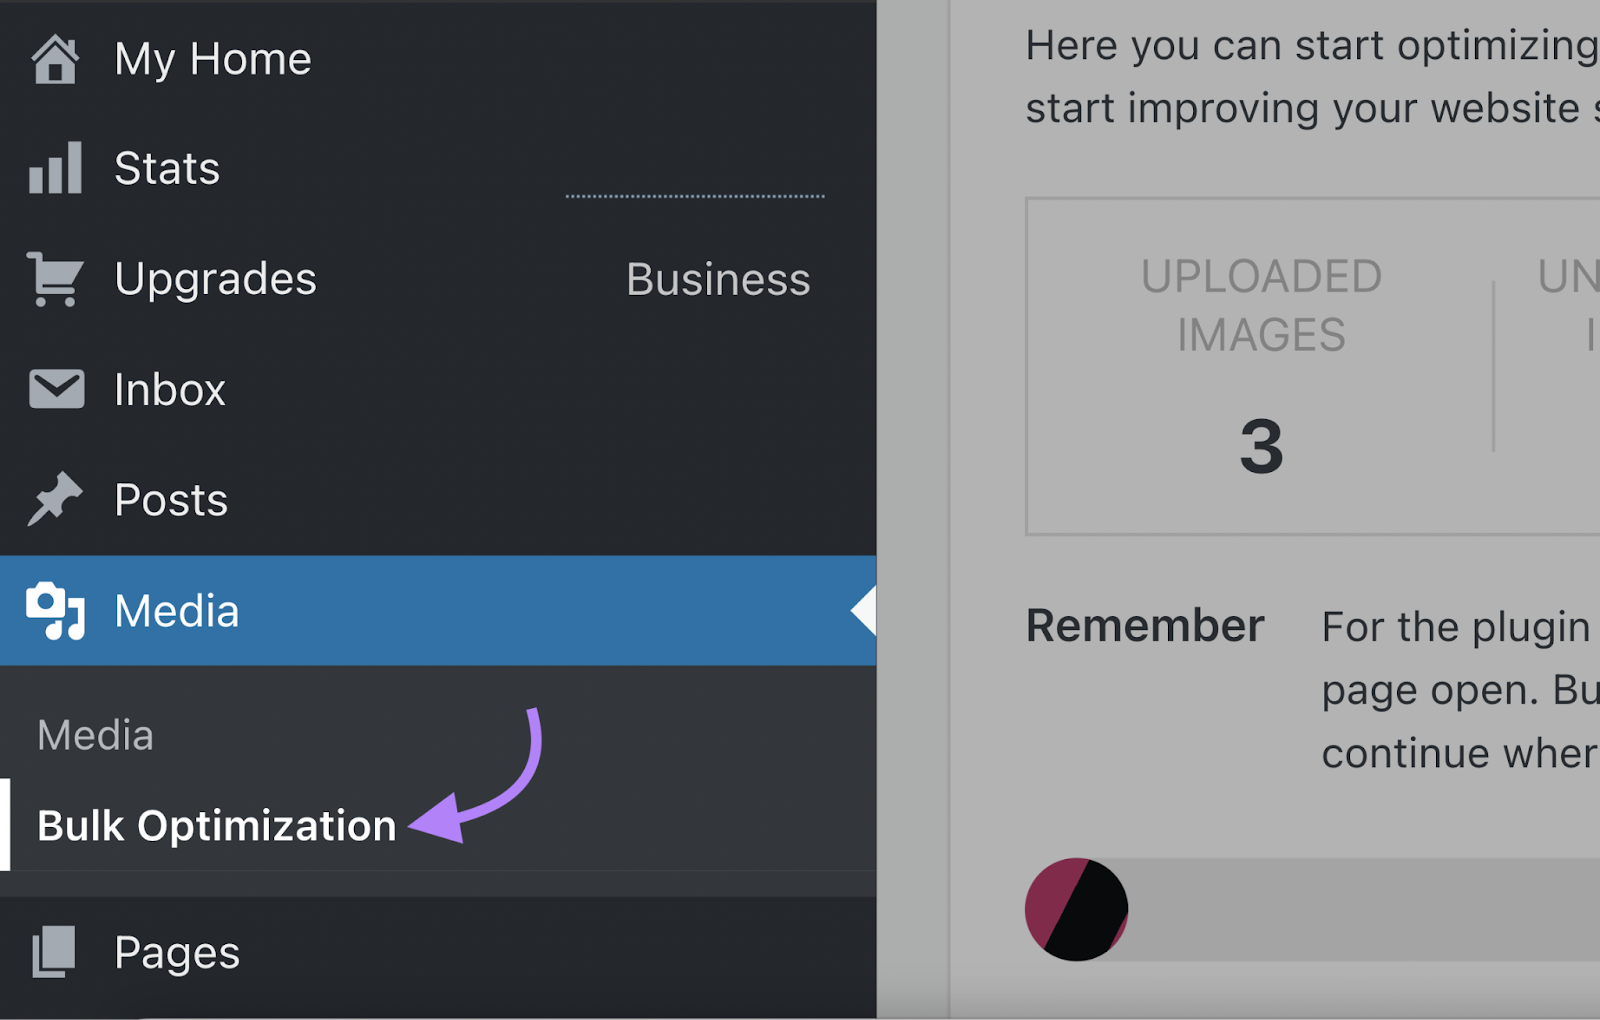
- Once you’ve registered your account, go to the “Media Library” and select “Bulk Optimization.”
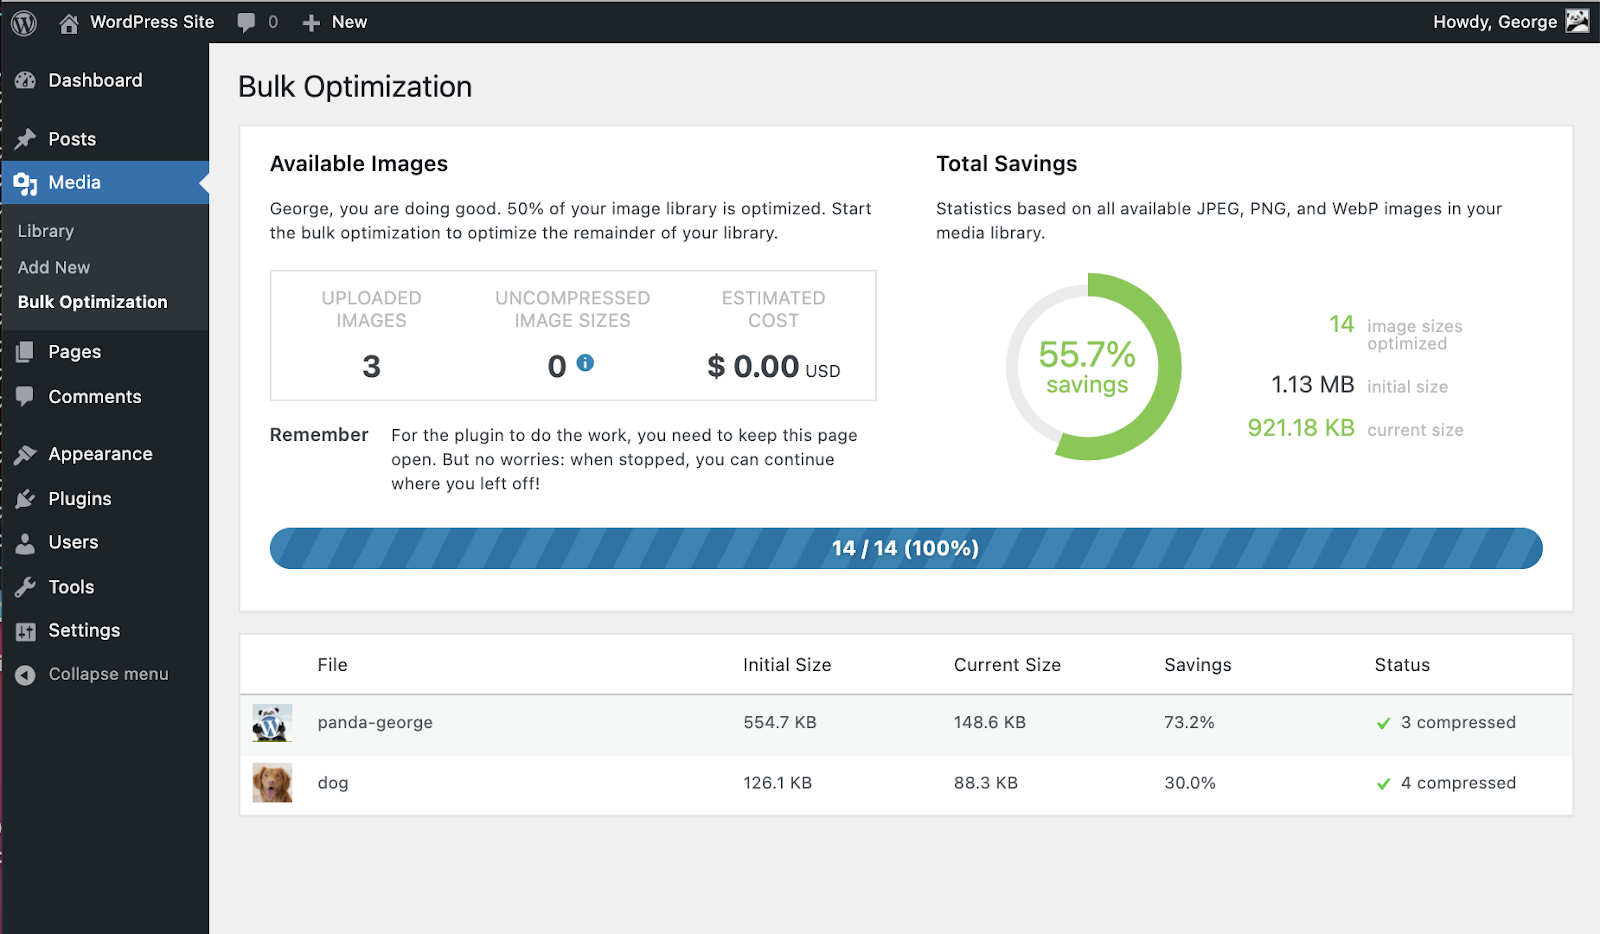
The plugin will show you how many images you’ve uploaded and how much space you’ve saved.
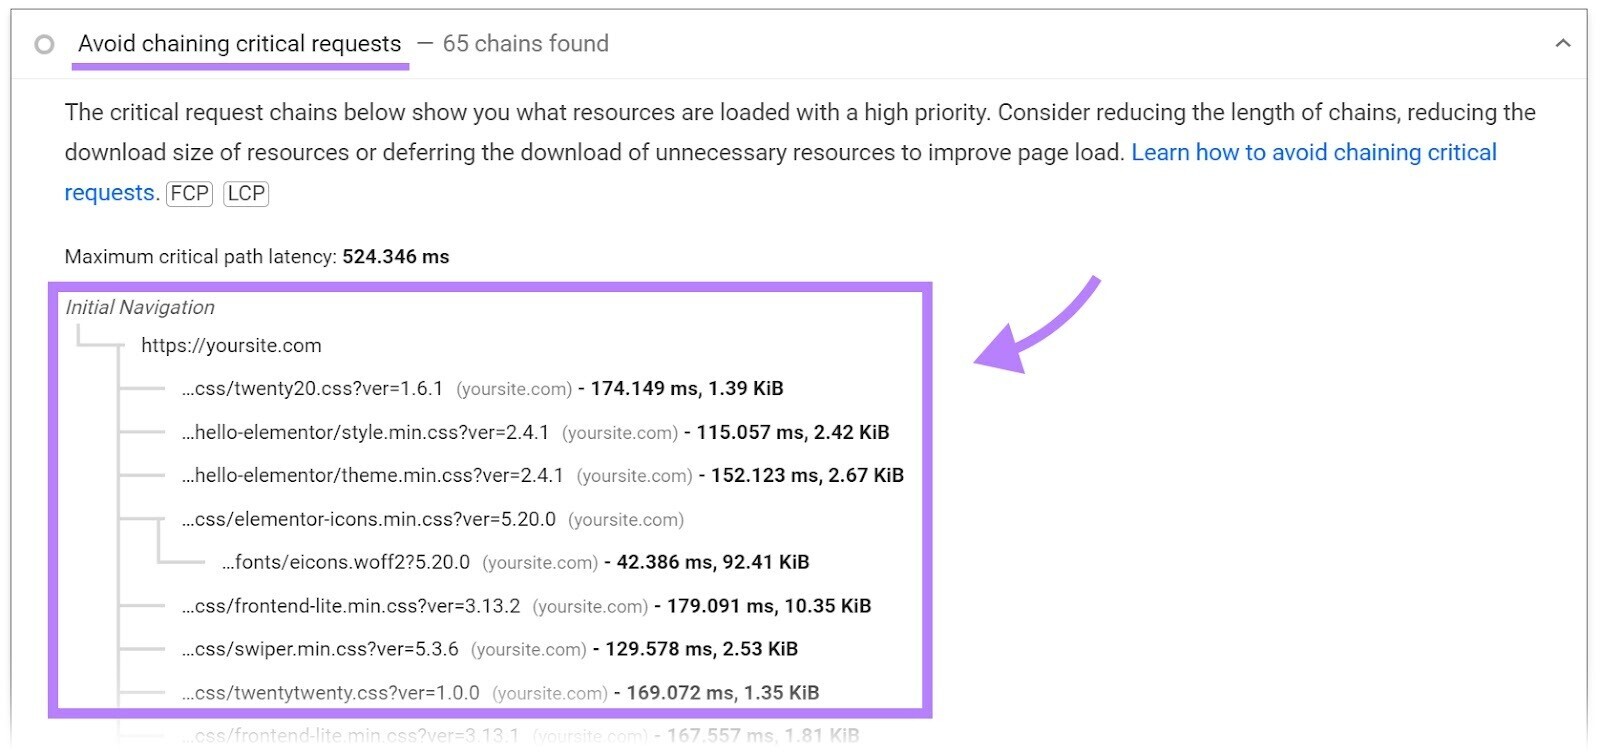
4. Avoid Chaining Critical Requests
Chaining critical requests is when a page needs to download multiple files and assets in order to load.
Let’s say you’re the ecommerce manager at a pet food store.
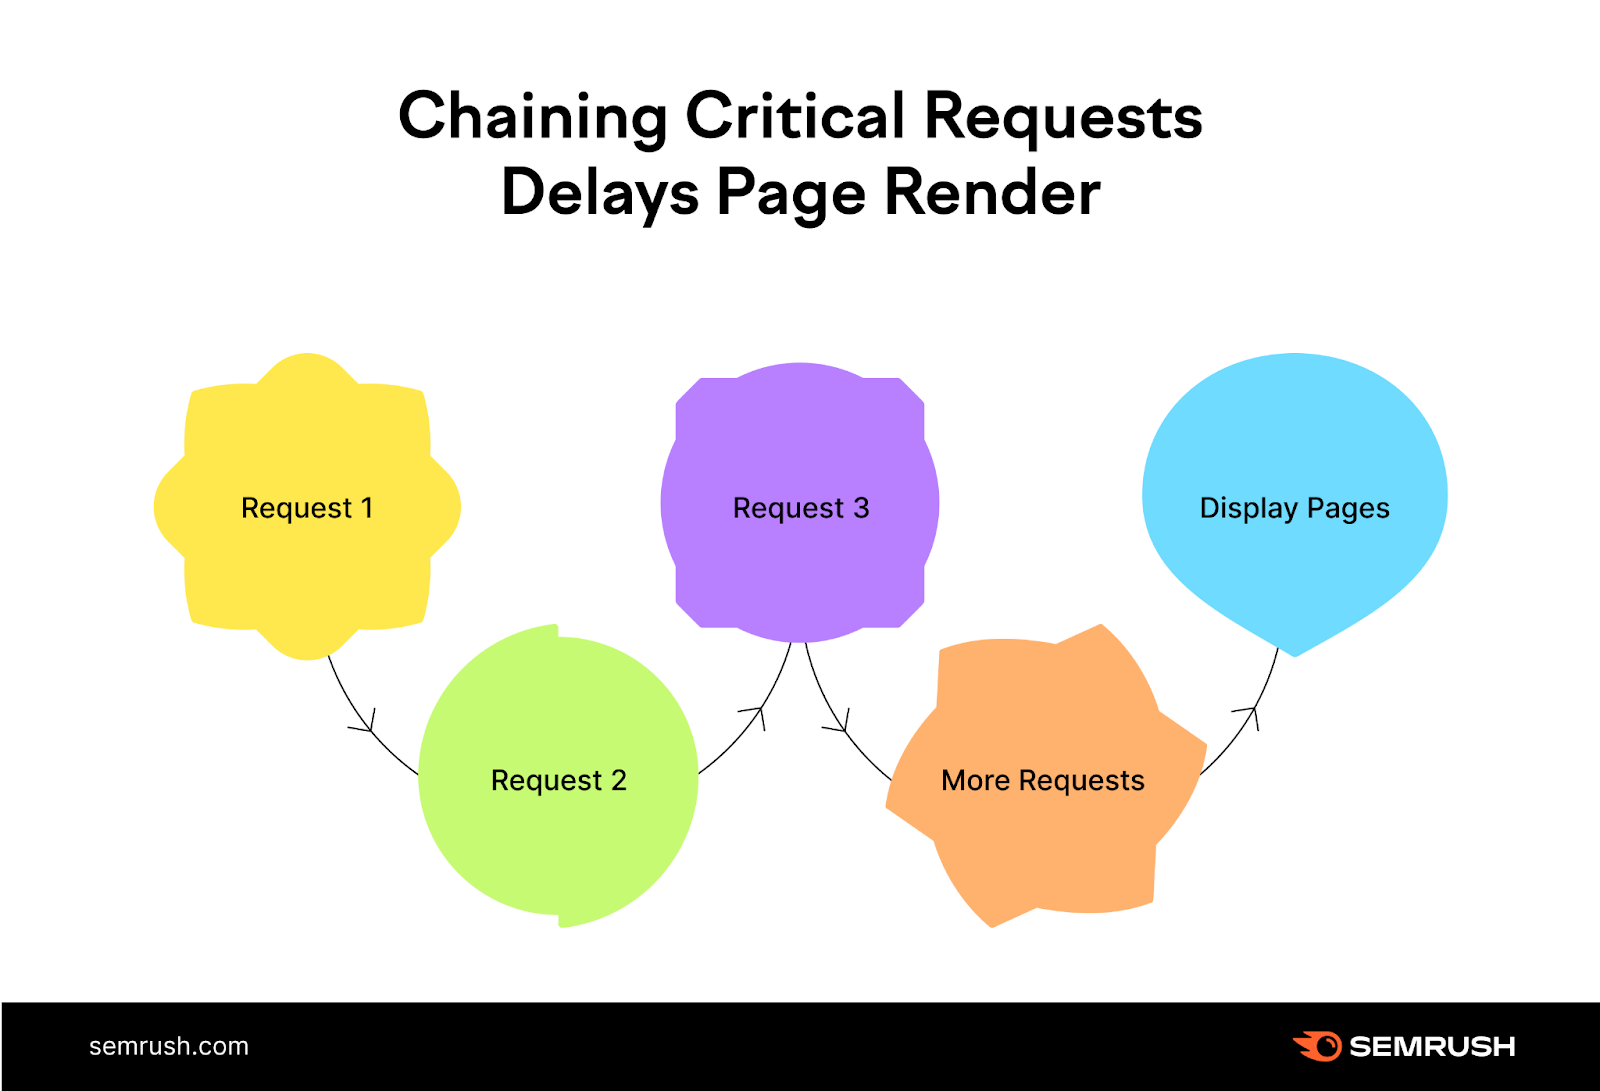
On your landing page for cat food, the text won’t show up until the images of cute kittens have loaded. And for the images to load, the CSS file needs to load first. And so on.
Each request depends on the previous request, creating a chain. And if any of the resources doesn’t load, the browser won’t render the page. Which can cause significant delays.
To avoid these chains, you need to set priorities. That way, the critical resources load first, so the page can be displayed. And the less important things are loaded afterward.
A good way to do that is by adding the attributes "async" and "defer" to your website code.
The "async" attribute tells the browser to continue loading and showing the rest of the page while the file or asset loads in the background.
The "defer" attribute instructs the browser to download the file or asset after the page is visible to the user. This way, the page is displayed first, and then the non-essential stuff loads.
If you’re not able to make changes to the website code yourself, you can ask a developer to add the “async” and “defer” script tags for you.
It’s important to note that using these attributes can cause issues with certain types of scripts. So, make sure to test thoroughly before implementing them on your site.
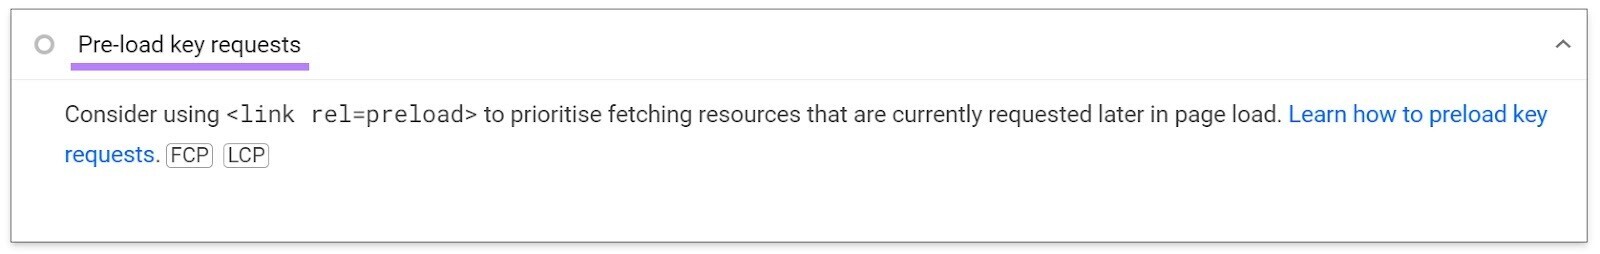
5. Preload Key Requests
Preloading key requests means telling the browser to prioritize critical assets and download them first. That way, the most relevant files can load faster.
Key requests are anything the page needs at an early loading stage. The most common key requests are fonts. But this can apply to JavaScript files, CSS files, and images, too.
If your site runs on WordPress, you can use plugins like Preload Images and Pre* Party that support preloading.
Otherwise, ask a developer to identify the critical requests and add the preload tag to the code.
6. Reduce CSS and JavaScript
CSS is an important part of web design. But CSS files are often larger than they need to be, which slows down your site.
Similarly, JavaScript is crucial to the functioning of your site. But it can also significantly slow down your website if the code isn’t optimized properly.
Reducing the size of your code—a process known as “minifying”—makes it load more quickly.

Minifying your code involves removing unnecessary characters from your CSS and JavaScript files. Such as white space and comments.
There are many tools to minify your code, such as Toptal CSS Minifier, Toptal JavaScript Minifier, and Minify.
You can also consider using JavaScript frameworks or libraries that are designed to be lightweight and fast-loading. Like jQuery or React.
If your site is on WordPress, you can use a plugin to help. Popular plugins for CSS and JavaScript minification include Hummingbird, LiteSpeed Cache, and W3 Total Cache.
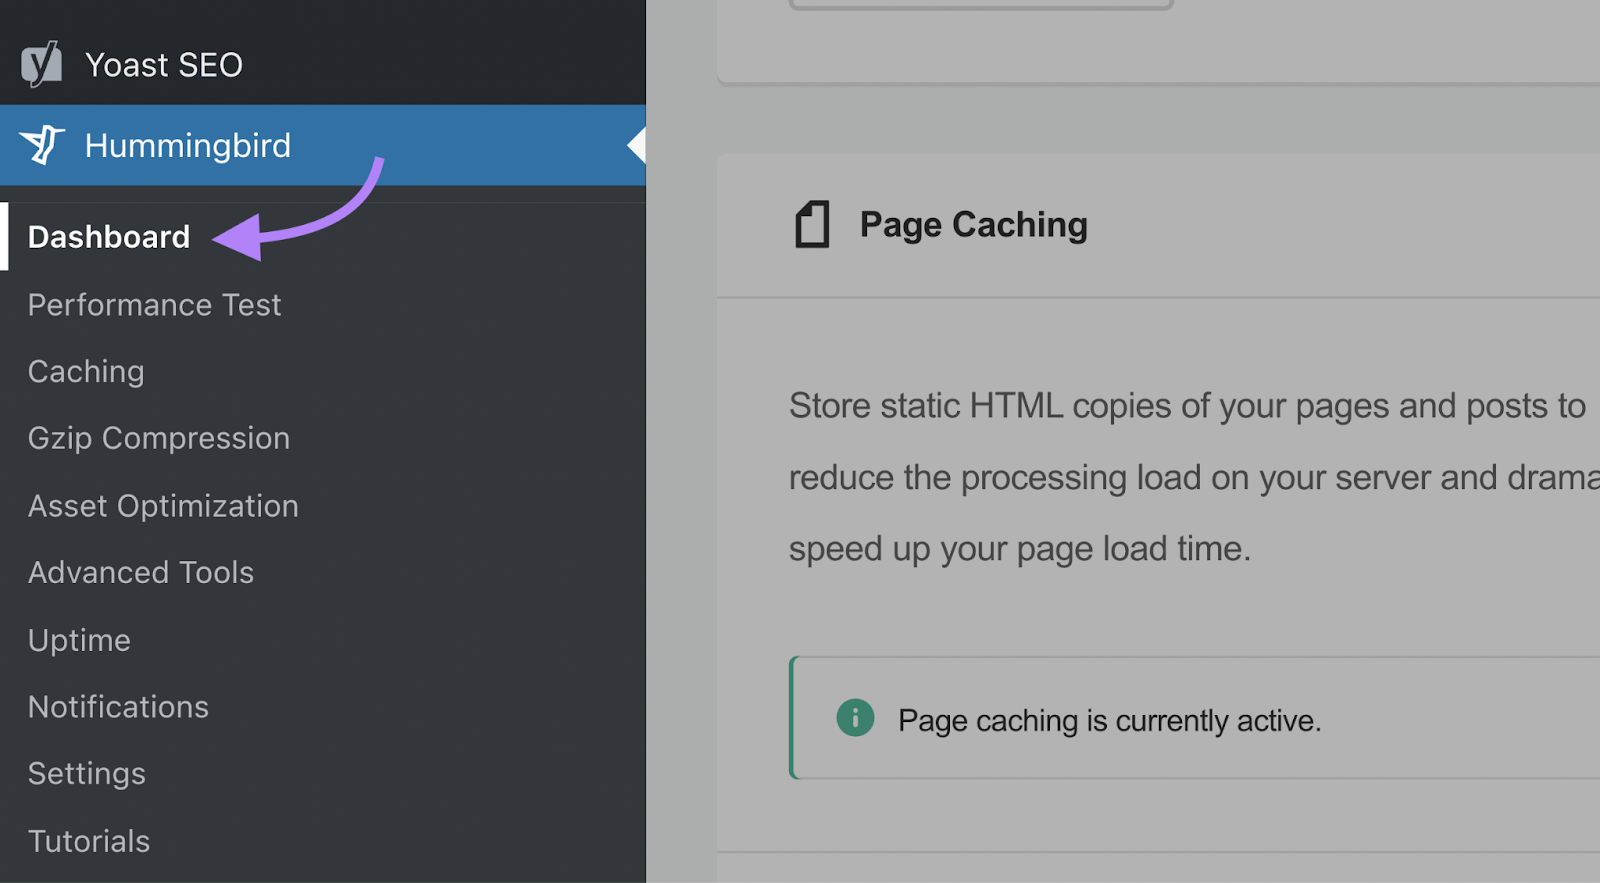
Here’s how to use Hummingbird to minify your code:
- Log in to WordPress and select “Plugins” from the dashboard menu
- To install Hummingbird, click “Add Plugin” then “Activate”
- Find “Hummingbird” in the dashboard menu, and complete the setup wizard
- Then head back to the “Dashboard”
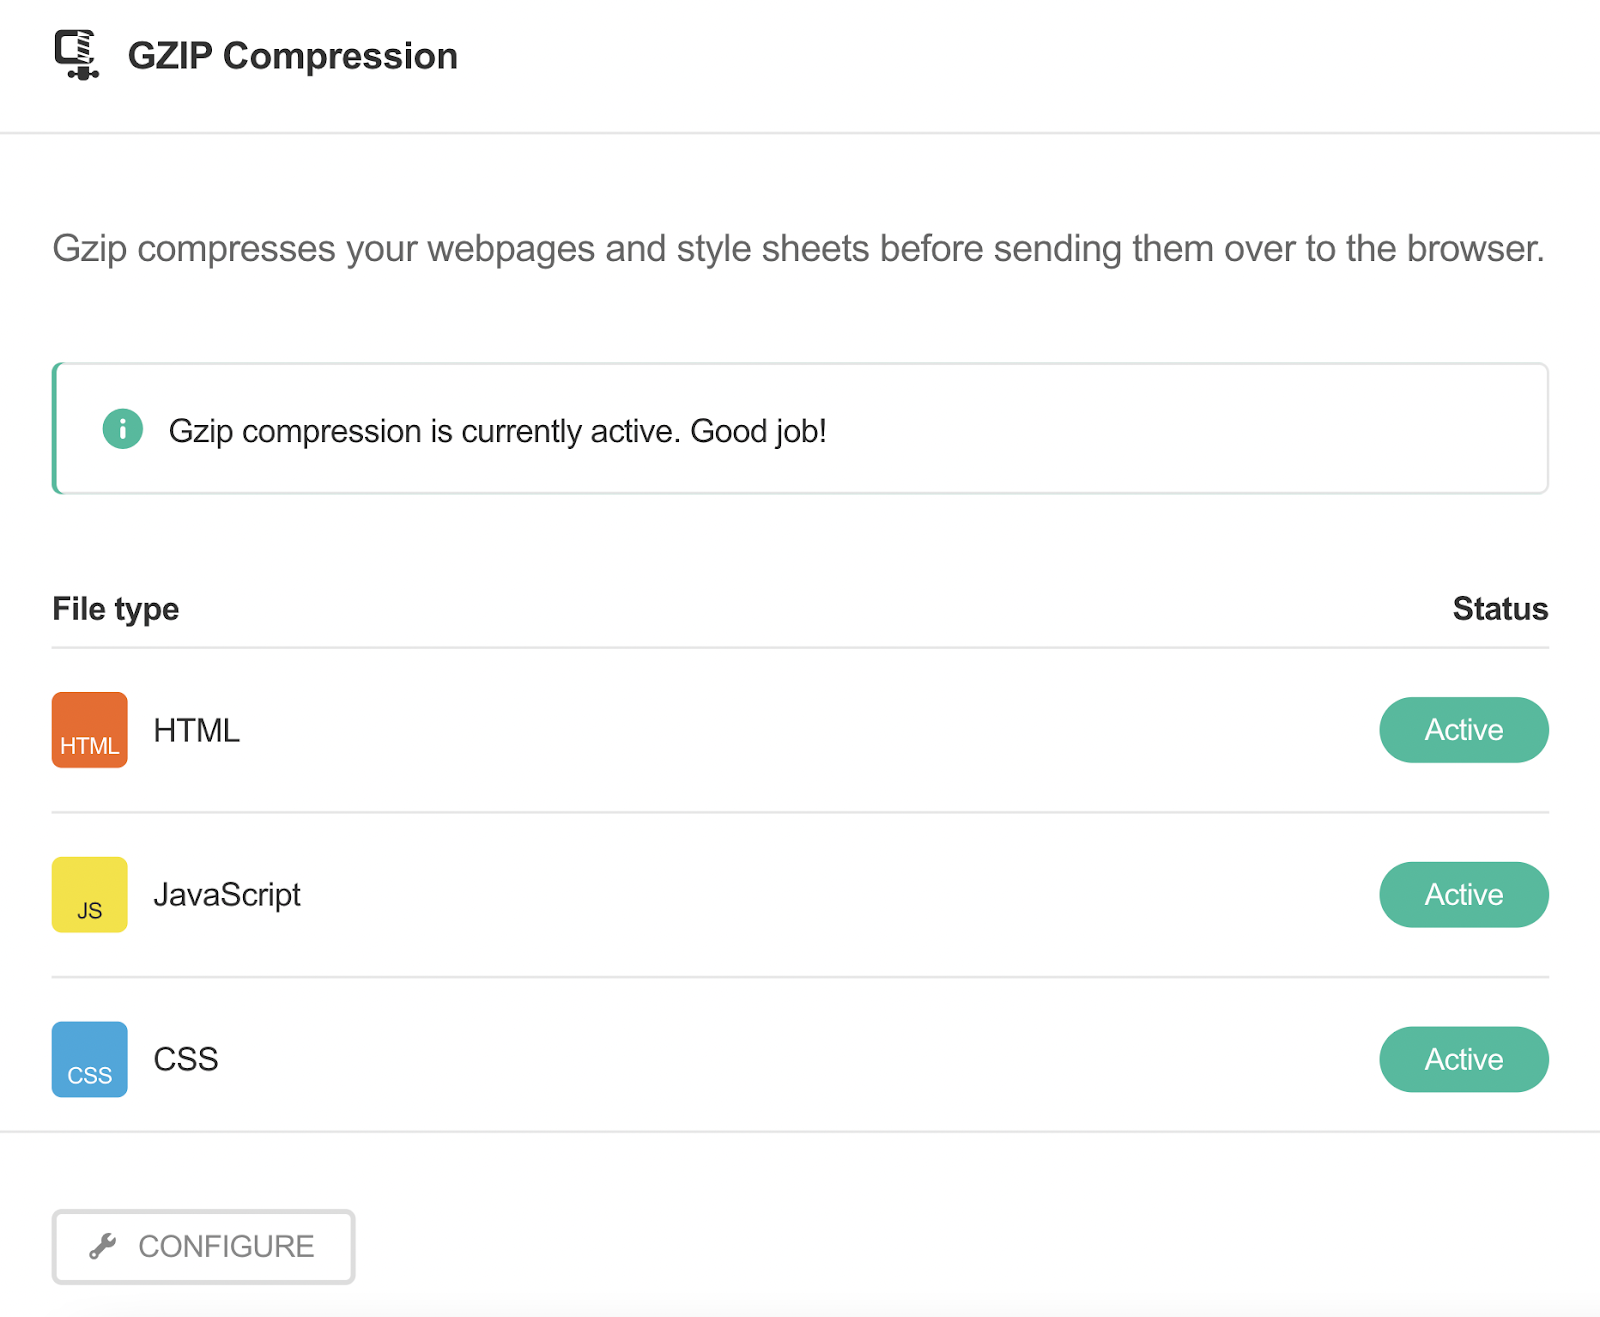
- Check that your files are marked “Active” in the Gzip Compression section.
Check out our guide to JavaScript SEO for more detailed instructions on how to optimize the JavaScript code on your site.
7. Defer Offscreen Images
Another way to address slow page speeds associated with images is to defer loading for offscreen images—meaning images that aren’t visible on the screen but are still being loaded by the browser.
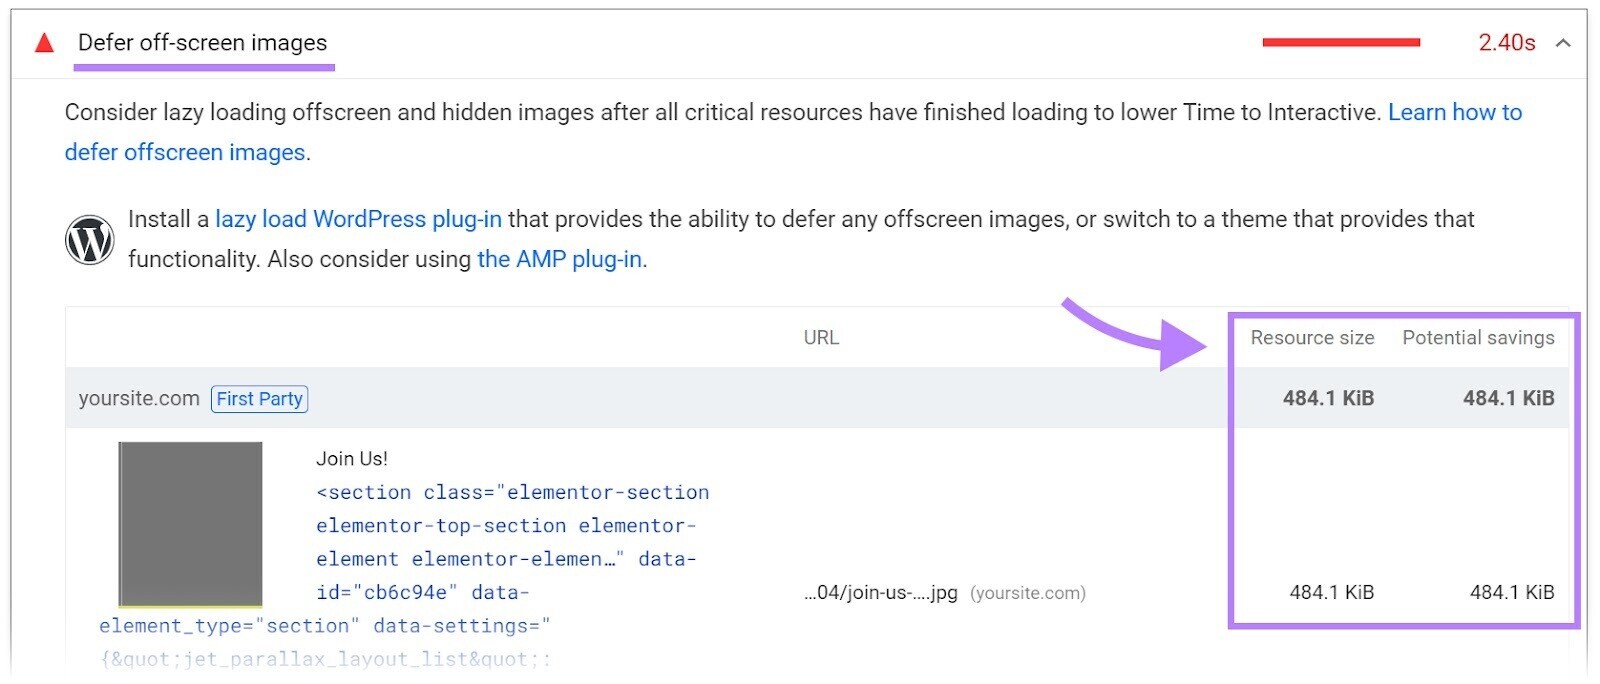
By deferring loading for non-visible images, you can prioritize the images that are visible. So, the page can load faster.
You can do this using lazy loading. Which means loading images only when they’re needed. Such as when they come into view on the screen.
This can significantly reduce the amount of time it takes to load a page, especially on mobile devices with slower internet connections.
WordPress has plugins that can do that for you, such as Lazy Loader.
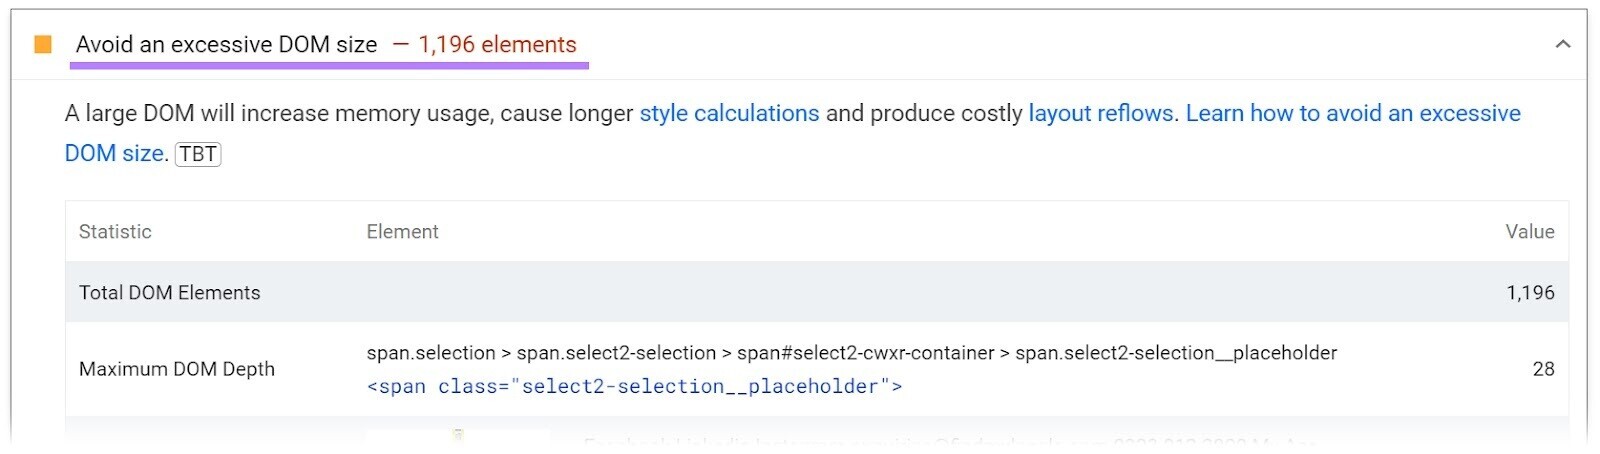
8. Reduce Document Object Model Size
The Document Object Model (DOM) is a tree-like representation of the HTML structure of a webpage. A large DOM size can lead to slow loading times and a poor user experience.
To reduce your DOM size, you can:
- Ask your dev team to remove unnecessary elements and attributes from the HTML code and remove unused JavaScript or CSS files
- Use server-side rendering (SSR) to render pages on the server before sending them to the client
- Avoid (most) visual page builders because they generate inflated HTML
- Don’t paste text into what-you-see-is-what-you-get (WYSIWYG) page builders
- Look for clean-coded themes and plugins
Tools like Google’s Chrome DevTools can help you analyze your DOM size and identify areas for improvement. You may need developer support to implement the changes.
9. Fix Multiple Page Redirects
Redirects automatically forward traffic from one URL to another. They can also slow down your page load speed.
Let’s say you try to access a page that’s been redirected. The server tells your browser that the page has moved. Then, your browser tries to retrieve the new URL. This additional step makes it longer to load the new page.
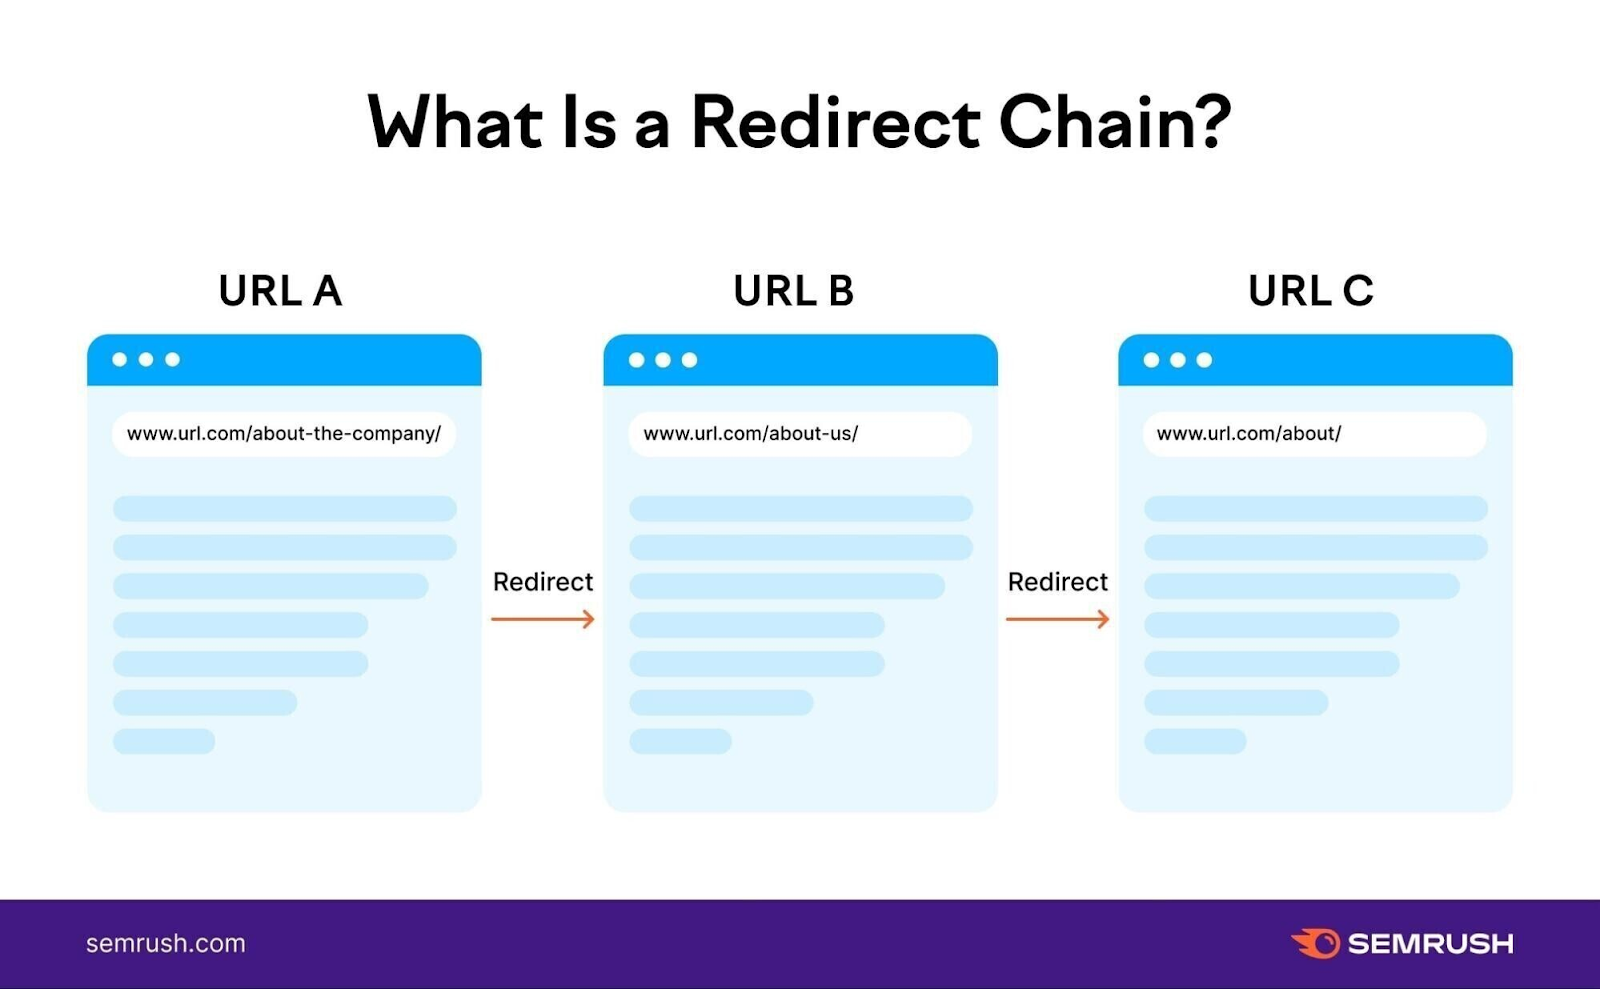
One redirect already affects page speed. But often, you can run into issues with multiple consecutive redirects. These are known as redirect chains.
Redirect chains often happen as old pages get deleted and newer ones take their place. As a result, there is more than one page between the original URL and the final URL. Like this:
Google can follow up to 10 redirects without reporting an issue in Google Search Console. But redirect chains can unnecessarily slow down your site.
So, it’s best to keep things simple to improve your PageSpeed Insights score. And you should redirect straight from the original URL to the newest URL.
The easiest way to get an overview of the redirects on your site is with an SEO tool like Site Audit.
Click the “Issues” tab and type “redirect” into the search bar.
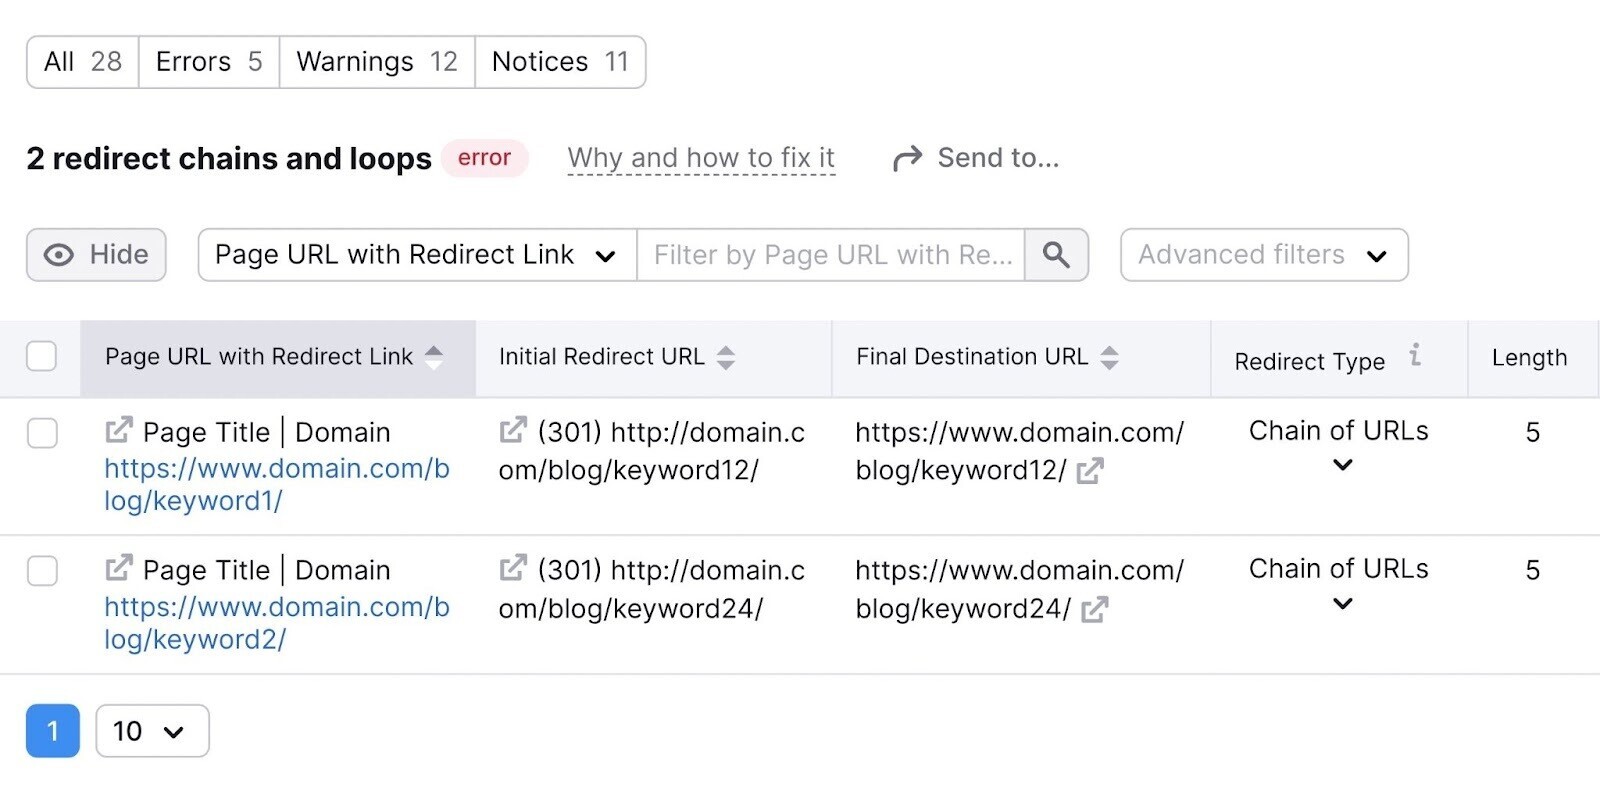
Then, click on “# redirect chains and loops.”

This will show you a report containing a list of pages, their redirect type, and the number of redirects.
If you’ve identified any redirect chains, you can likely log in to your content management system (CMS) to fix them. You’ll need to delete the unnecessary redirects and implement a new redirect sending traffic only from the original page to the current one.
Many free WordPress plugins (including Easy Redirect Manager, Redirection, and Simple Page Redirect) will help you modify or set up redirects.
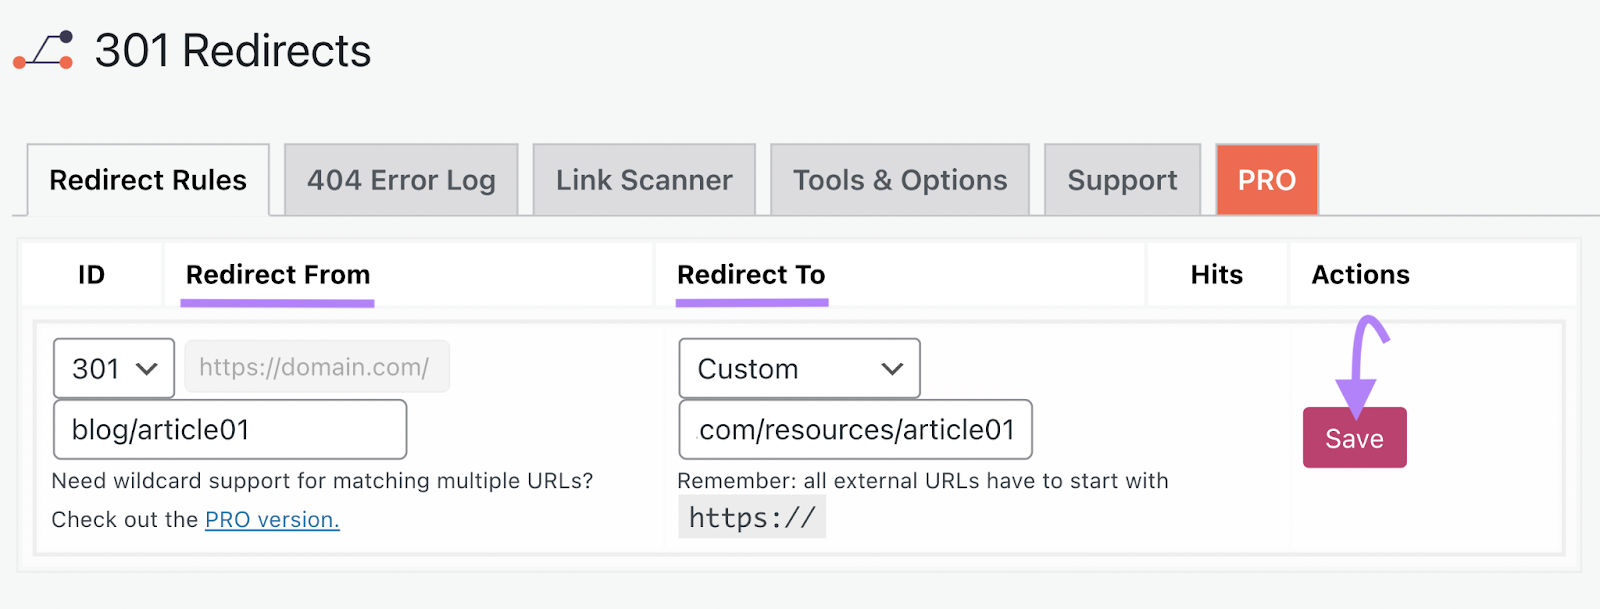
Here’s how to do it with Easy Redirect Manager:
1. Log into WordPress, click “Plugins” and then “Add New.”
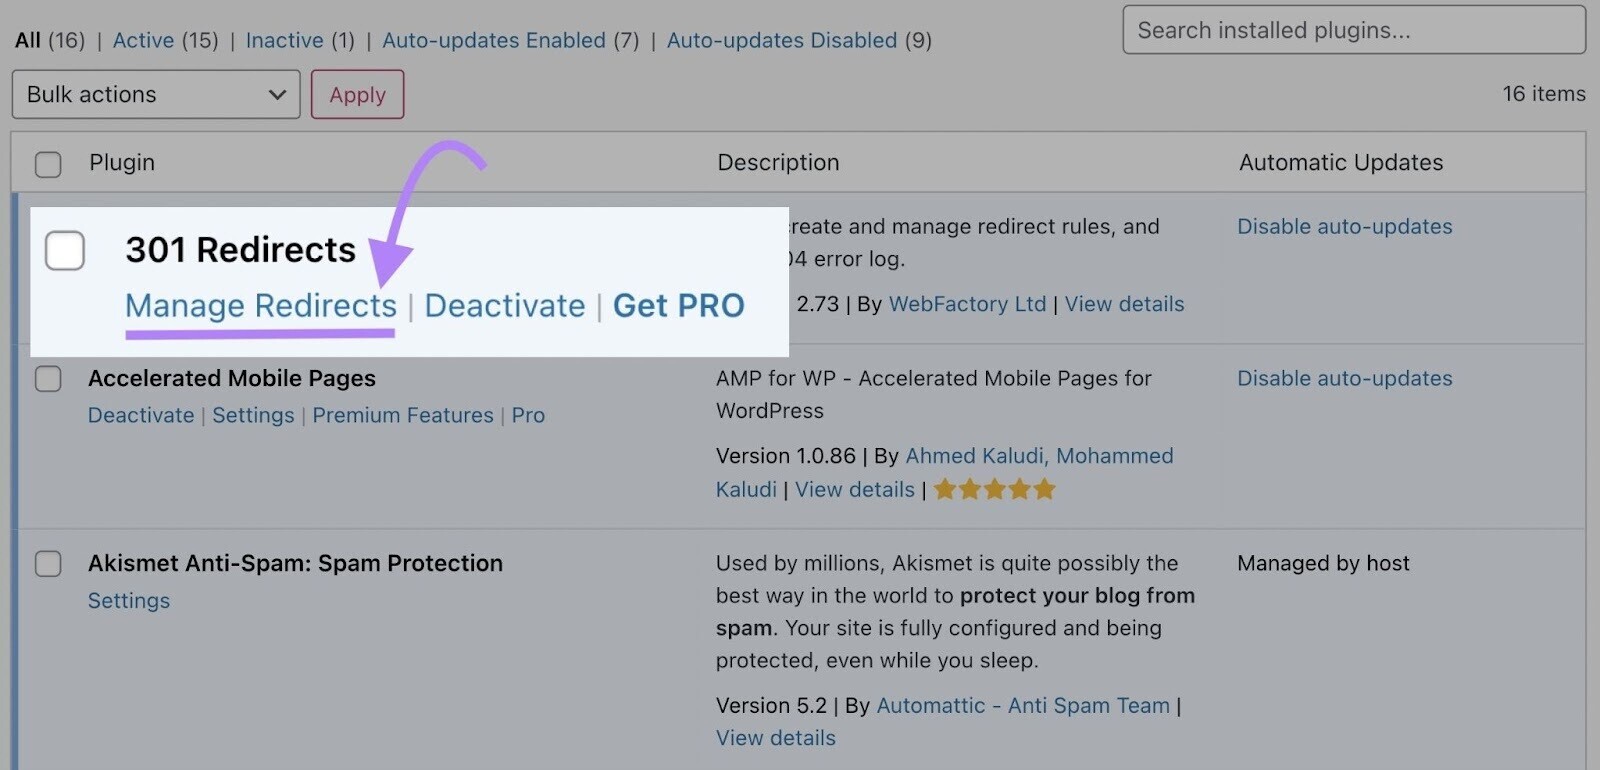
2. Search for “Easy Redirect Manager.” Then, click “Install and activate.”
3. Then click “Manage Redirects.”
4. In the “Redirect Rules” tab, enter the address of the old URL and the one you want to redirect to. And click “Save.”
10. Avoid Overusing Third-Party Code
Third-party code includes scripts, pixels, and plugins. It can slow down page loading times and negatively impact your PageSpeed Insights score.
Third-party code typically comes from other companies—such as analytics tools and advertisers—monitoring your site performance.
Some third-party code is necessary and useful. For instance, you might have the Google Analytics pixel to measure website performance. Or the Facebook pixel to track ad campaigns.
But you likely have some unnecessary third-party code. Like tools and platforms you no longer use.
That’s why you should regularly audit third-party code on your site. And remove anything that isn’t necessary.
In your PageSpeed Insights report, Google flags third-party code. Along with the transfer size and main-thread blocking time.
Pay special attention to the company names in the gray bars. These are the third-party companies running code on your site. Google also categorizes them (Tag Manager, Social, Utility, Analytics) to help you understand their purpose.

Make note of any company names you don’t recognize or no longer need. And take steps to remove their code.
This is likely to involve deleting the code from your CMS, uninstalling plugins if your site is on WordPress, or removing tags from your tag management tool.
Audit Your Site to Monitor & Fix Page Issues Faster
If you want to conduct a more detailed site audit, use the Site Audit Tool. It scans your website for over 140 technical and SEO issues. And generates an in-depth report that identifies all areas needing improvement.
Let’s take a look:
Head to the tool and select your website.
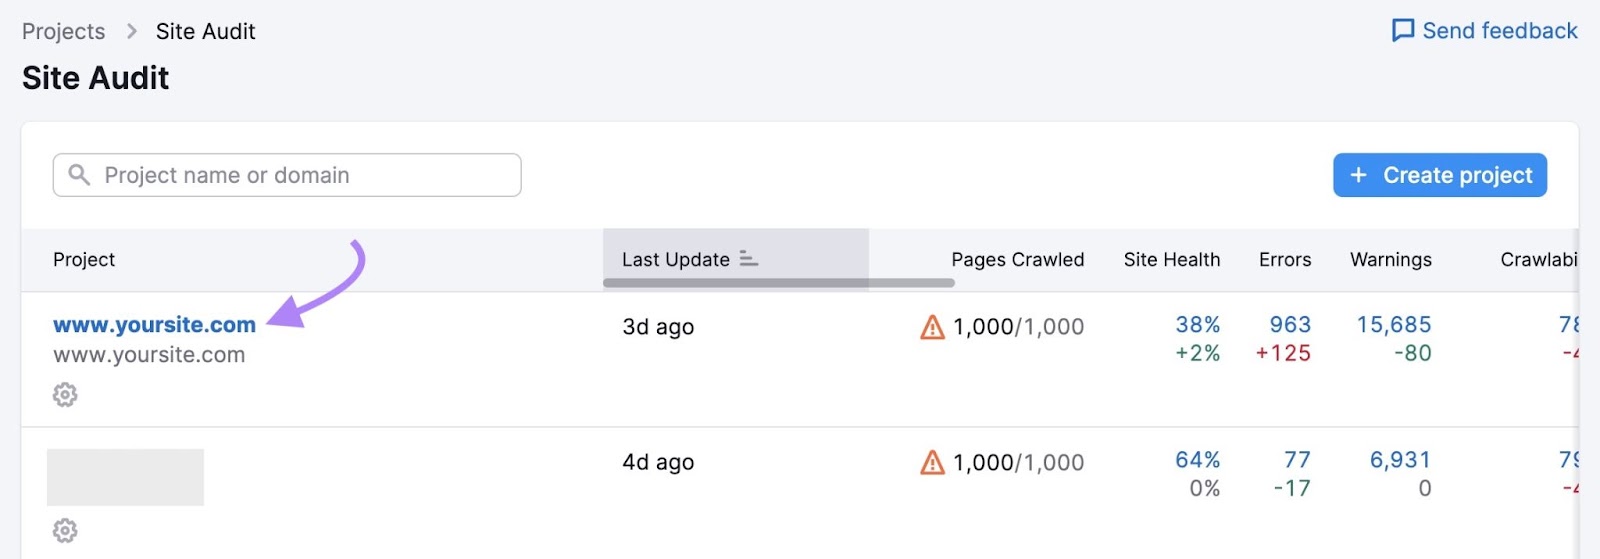
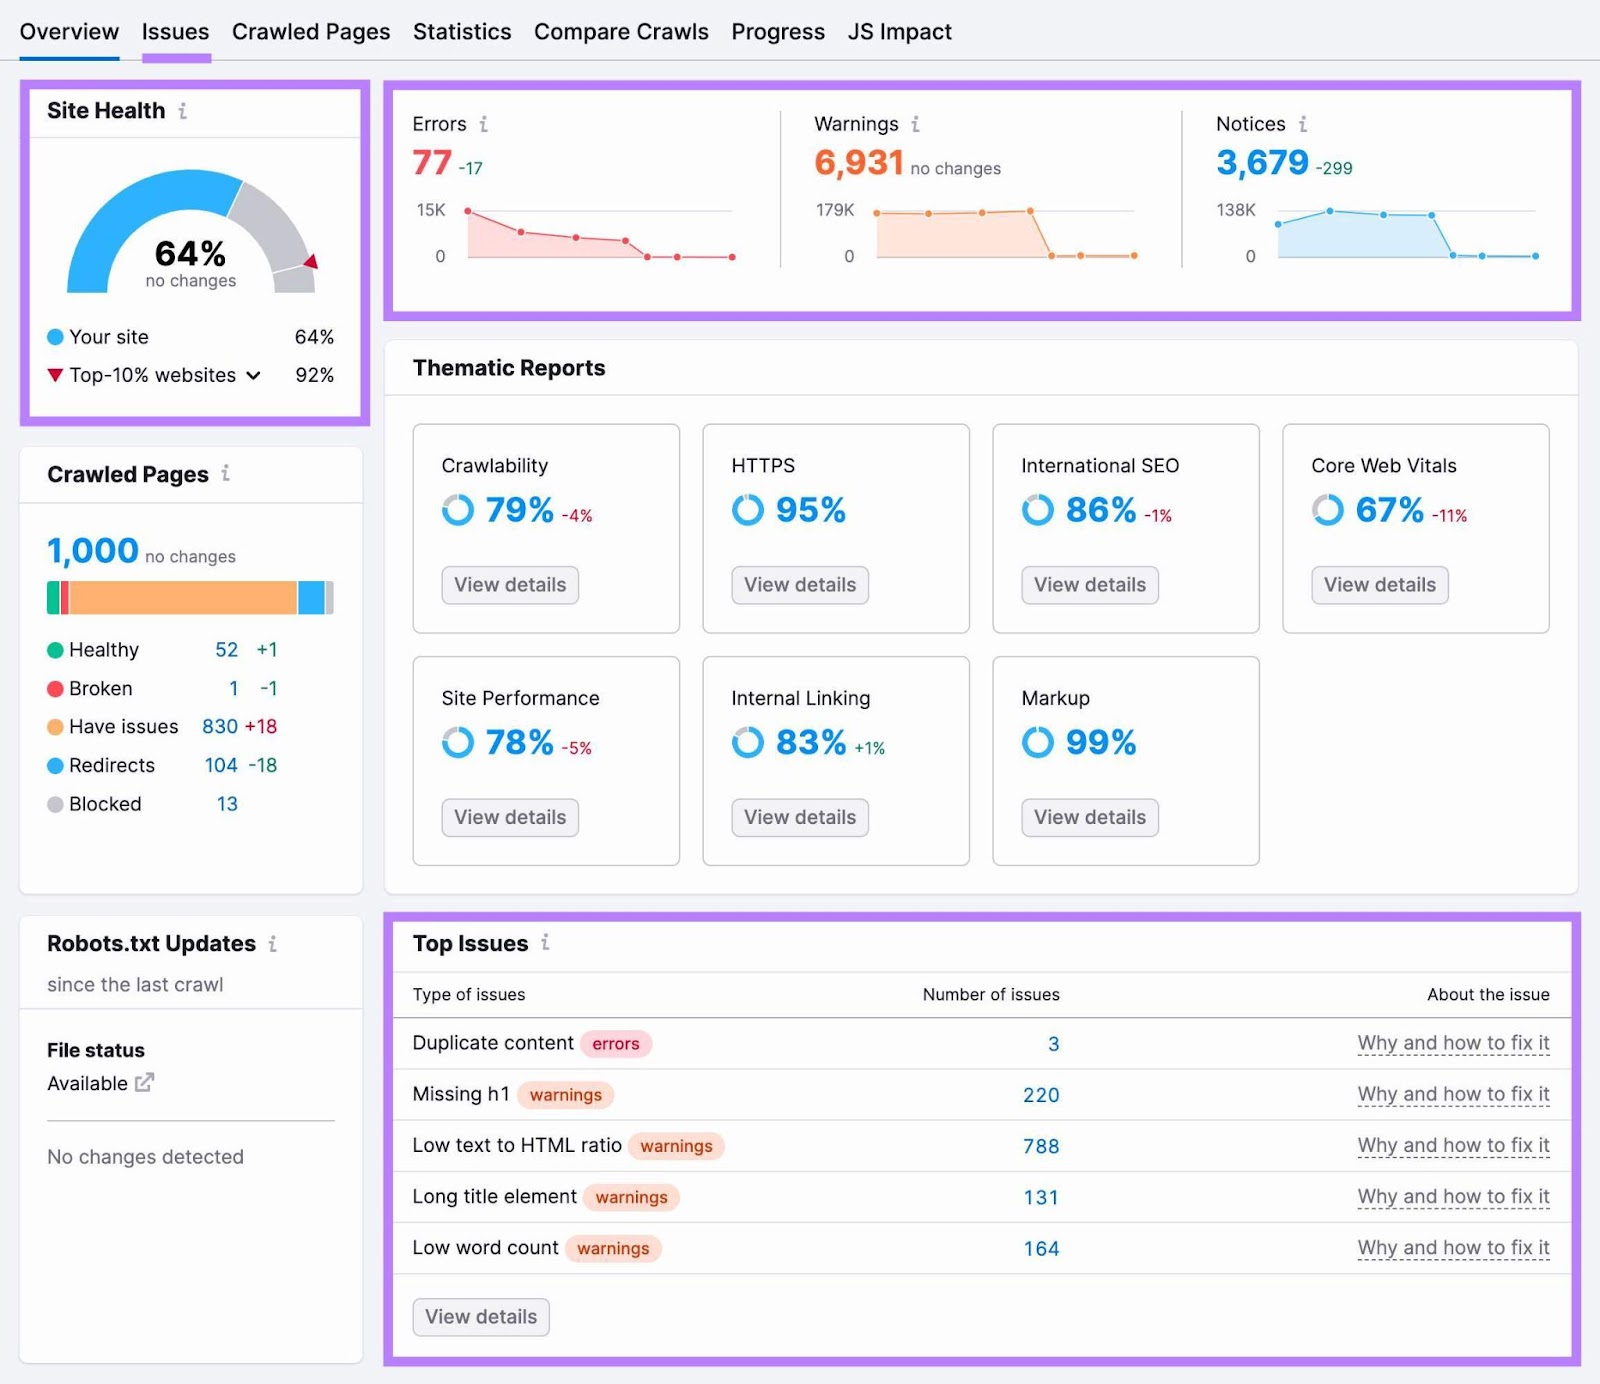
In the “Overview” tab, you’ll see the “Site Health” metric.
This metric shows your website health score on a scale from 0 to 100. And tells you how it stacks up against other sites in your industry.
You’ll also see an overview of the “Errors,” “Top Issues,” etc. found on your site.
Next, click on the “Issues” tab.
The tool will show you a complete list of “Errors,” “Warnings,” and “Notices” that need your attention.
It’ll also highlight the number of affected pages.
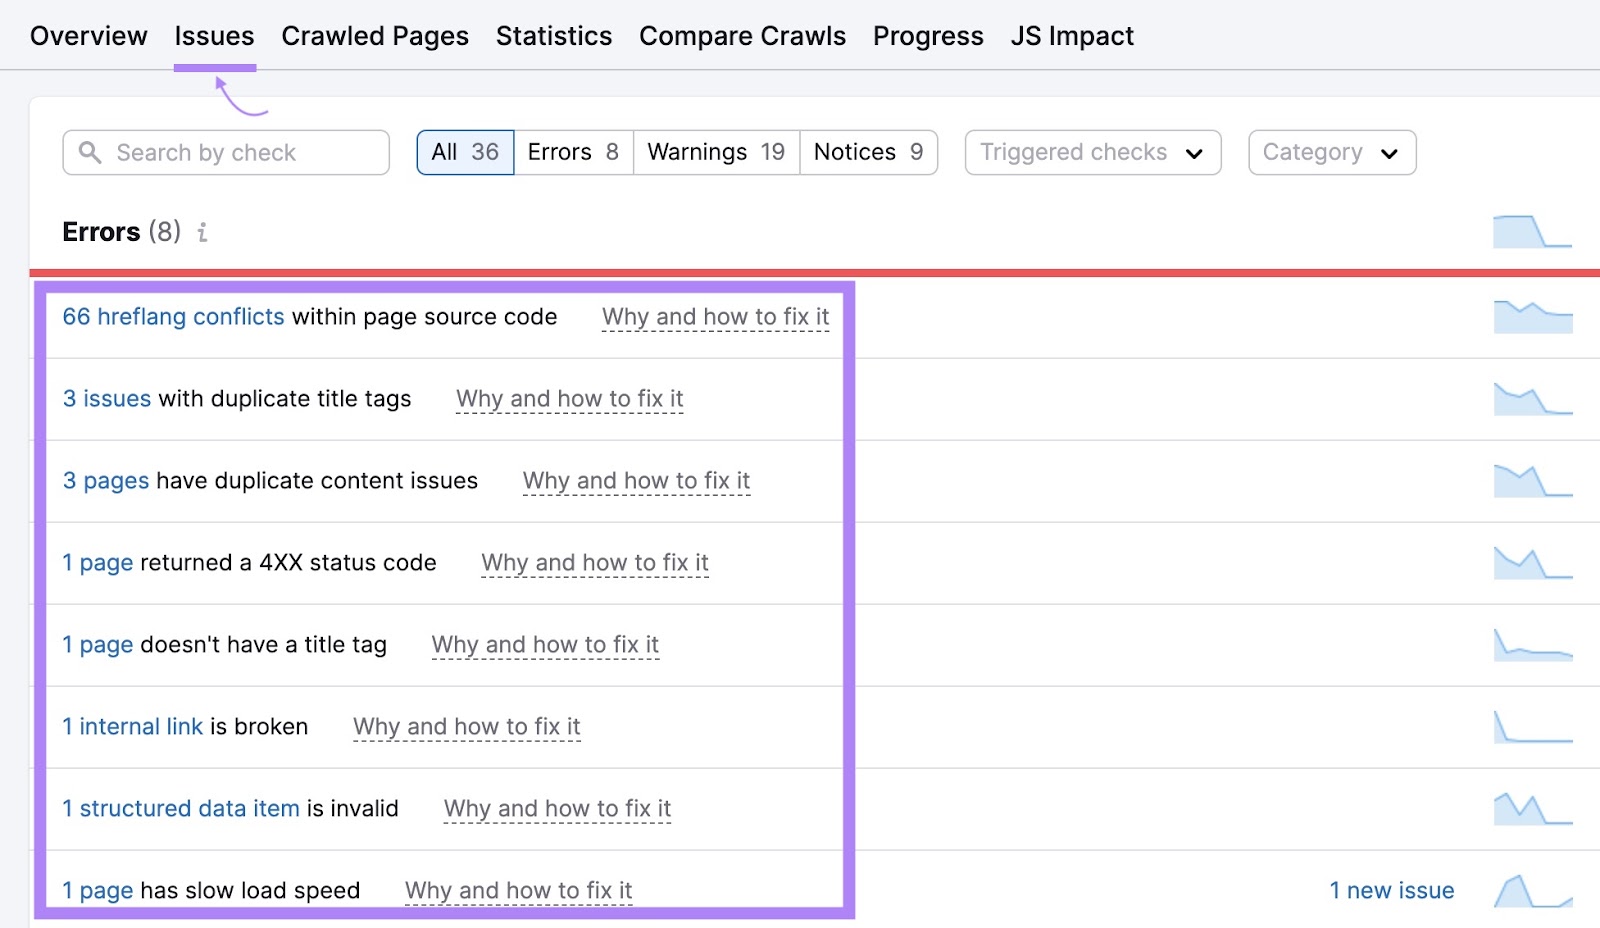
Click on “Why and how to fix it” to see the details of a specific issue. And the solution to fix the issue.

This will help you identify and resolve most issues that affect your site’s overall health and SEO, in addition to improving the PSI score.
Plus, Semrush shows your progress over time. Like this:
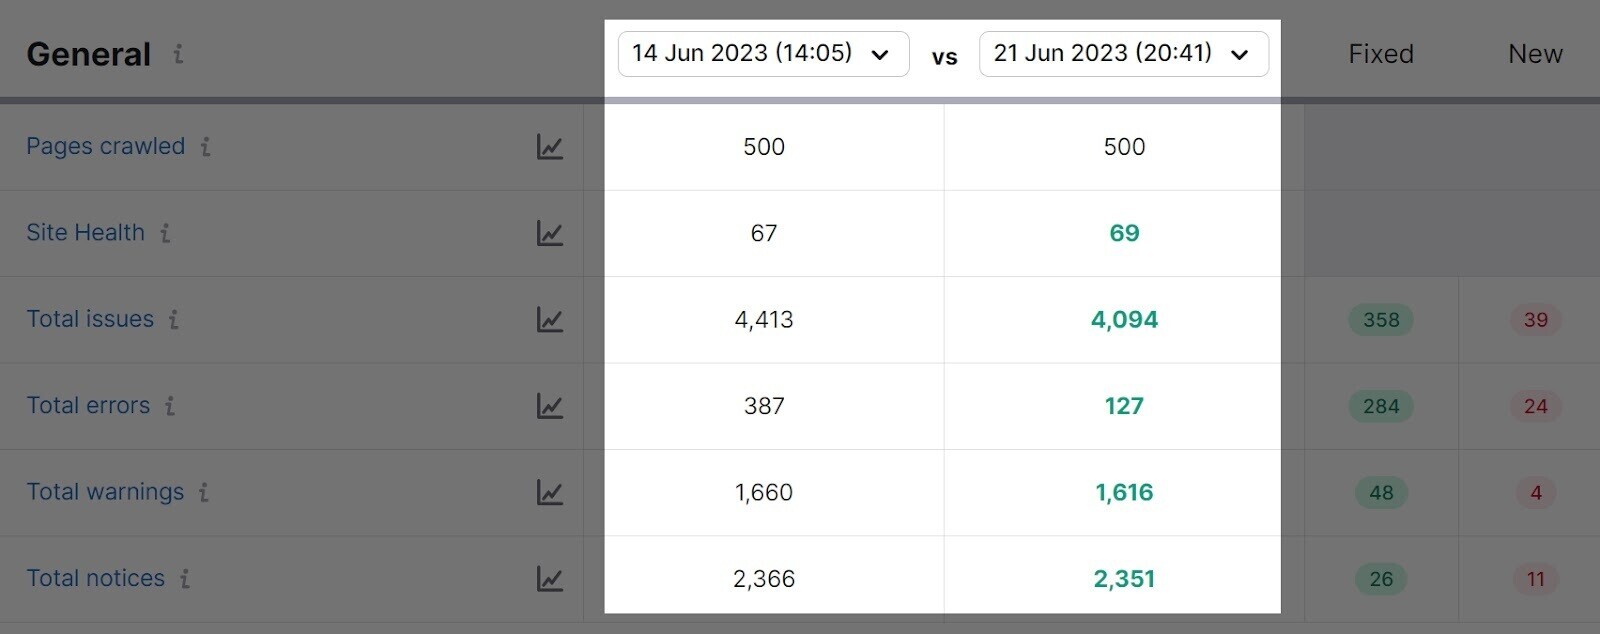
You can even set up automated audits to stay on top of any issues that arise.

Sign up for a free account today to get started.