Since the start of the pandemic, the ecommerce market has experienced unprecedented growth. The so-called “pandemic effect” generated large spikes in online shoppers, drove many new consumers to the industry, and accelerated the arrival of ecommerce business formats like online grocery shopping and last-mile deliveries.
The industry as a whole looks quite different than it did prior to 2020, and emerging trends suggest ecommerce will continue to evolve at a rapid pace in the future.
We've been studying the depth of the ecommerce boom in 2021 and wanted to highlight some trends that will shape the future. The insights we uncovered have value for any business hoping to thrive in an increasingly digital world.
In this post, we offer an overview of some of our findings. To explore these findings for yourself, or uncover trends related to your particular niche, you can go deeper with the Semrush Traffic Analytics tool.
Will the Ecommerce Market Continue Growing?
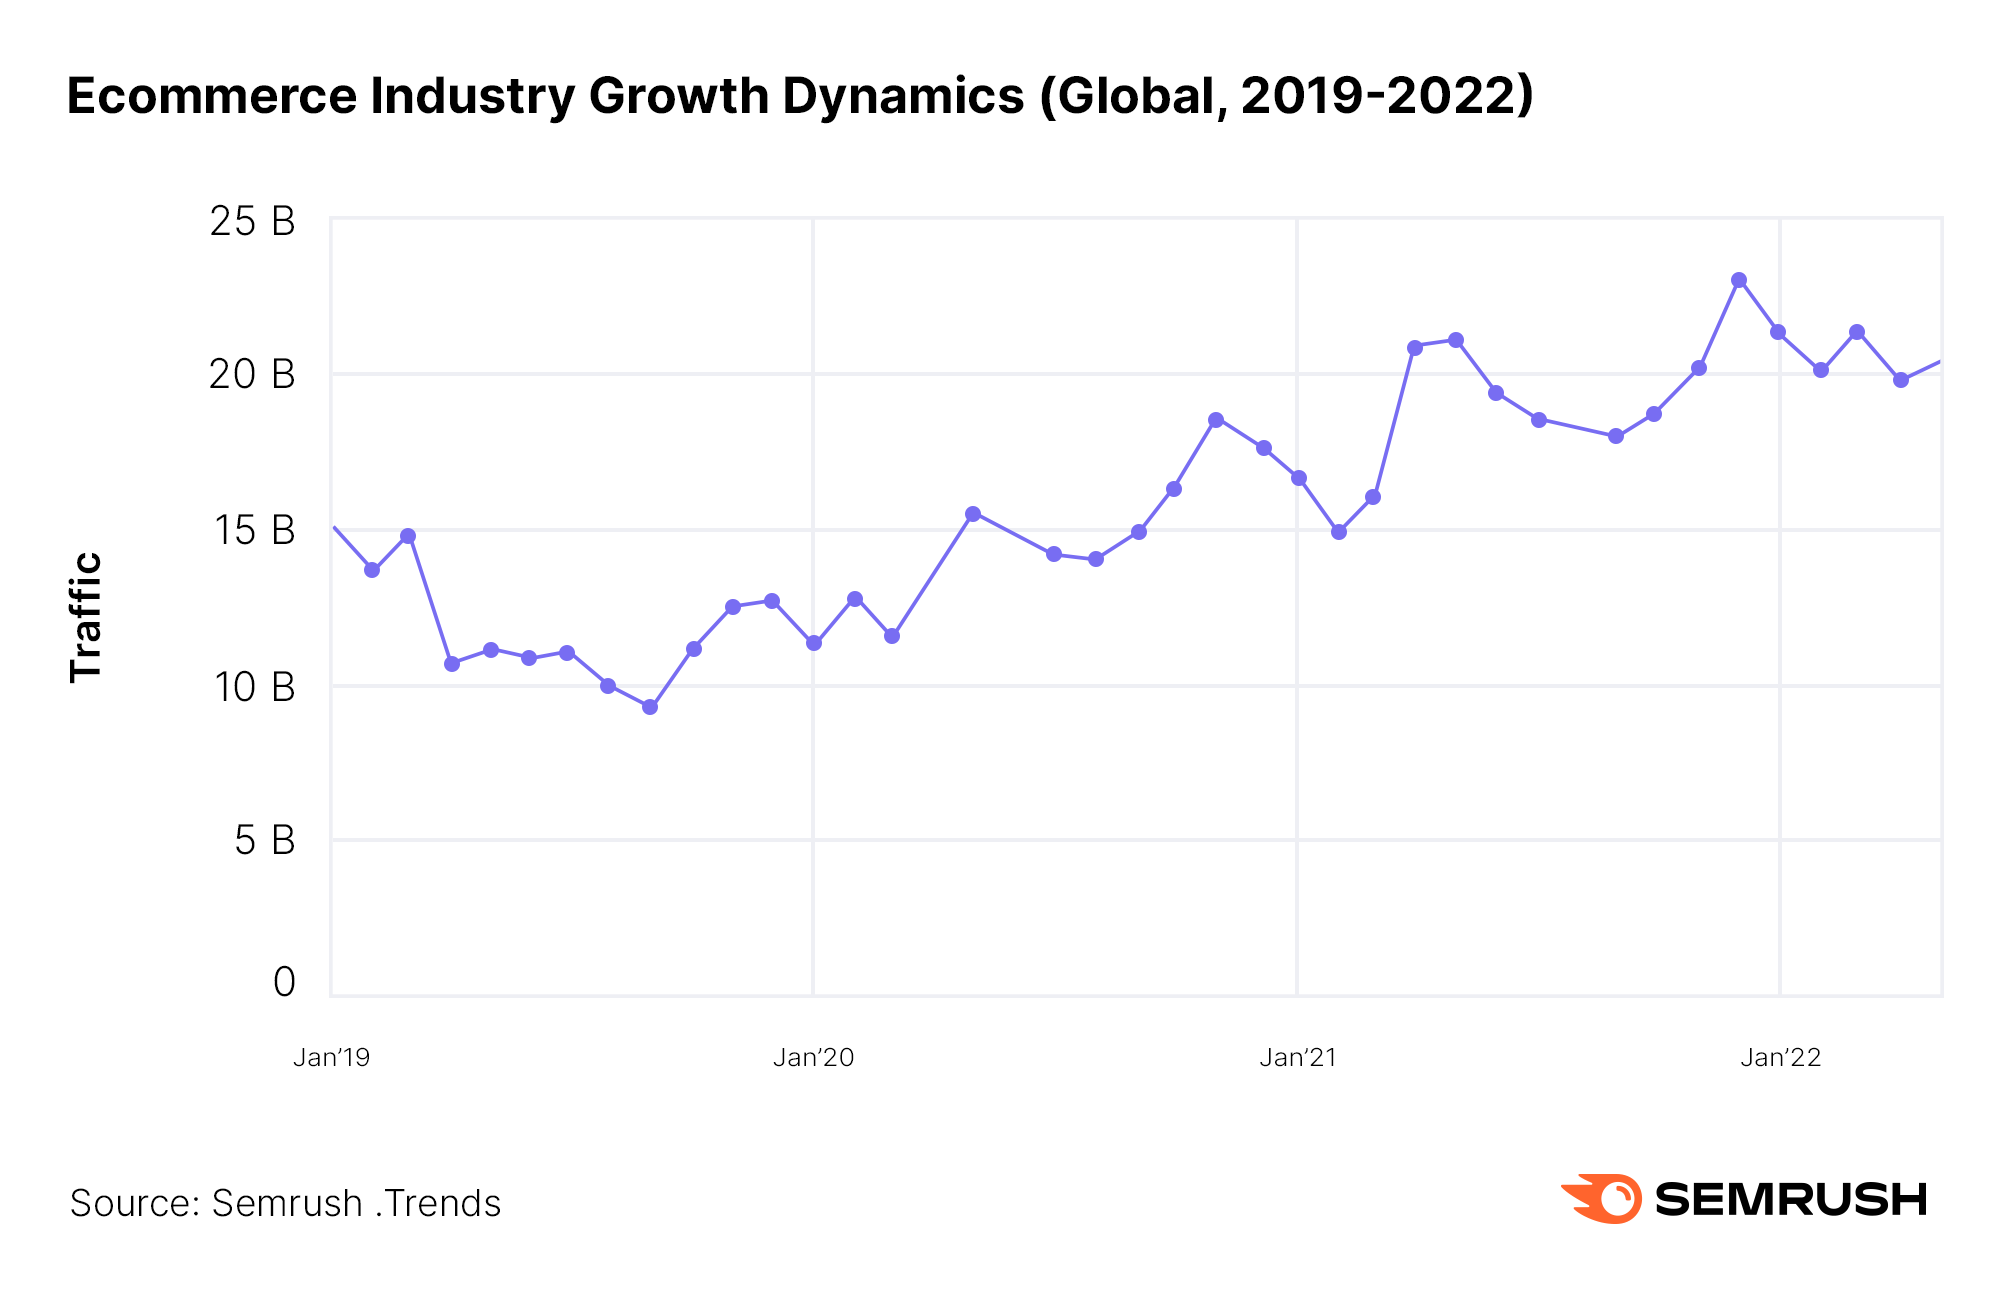
In dollars, the ecommerce industry has seen double-digit growth rates for the past decade. Industry traffic has followed a similar pattern with shoppers increasingly moving to online platforms to do their shopping.
COVID only fueled this trend. Year-over-year (YoY) traffic trends across the entire industry rose 73% from 2019 to 2022. If we look at the hottest months for ecommerce—namely, the winter holiday months—we see significant increases. Traffic in December 2021, for example, reached an all-time high.
But the question remains: will growth continue to boom as we move through 2022 and beyond?
Traffic data shows that while interest in online shopping platforms is at all-time highs, it may be cooling off. YoY traffic growth in 2020 was at 23%. A year later, in 2021, growth stood at 29%. So far in 2022, we've only seen a 9% increase in traffic, drastically lower than 2021's total of 29%. By the end of 2022, however, the traffic increase could turn out to be significantly higher than 9%, especially after holiday shopping. But with looming economic concerns, this year’s increase may be a bit more modest.
For ecommerce businesses, this could mean simply relying on overall market expansion as a driver for business growth is no longer a viable strategy. As market growth slows, you should refocus your marketing strategy on winning more market share.
What Regional Variations Impact the Ecommerce Industry?
While the majority of online shoppers and top brands come from the US, a comparative view of the ecommerce landscape across the globe can also provide interesting insights. To consider global stats alongside regions individually, we used Semrush Traffic Analytics to explore the depth of regional differences to see how the trends vary from the top-performing region to other locales.
Top Players Across the Globe
While major players like Amazon dominate the ecommerce market in almost every country, there are some regional nuances.
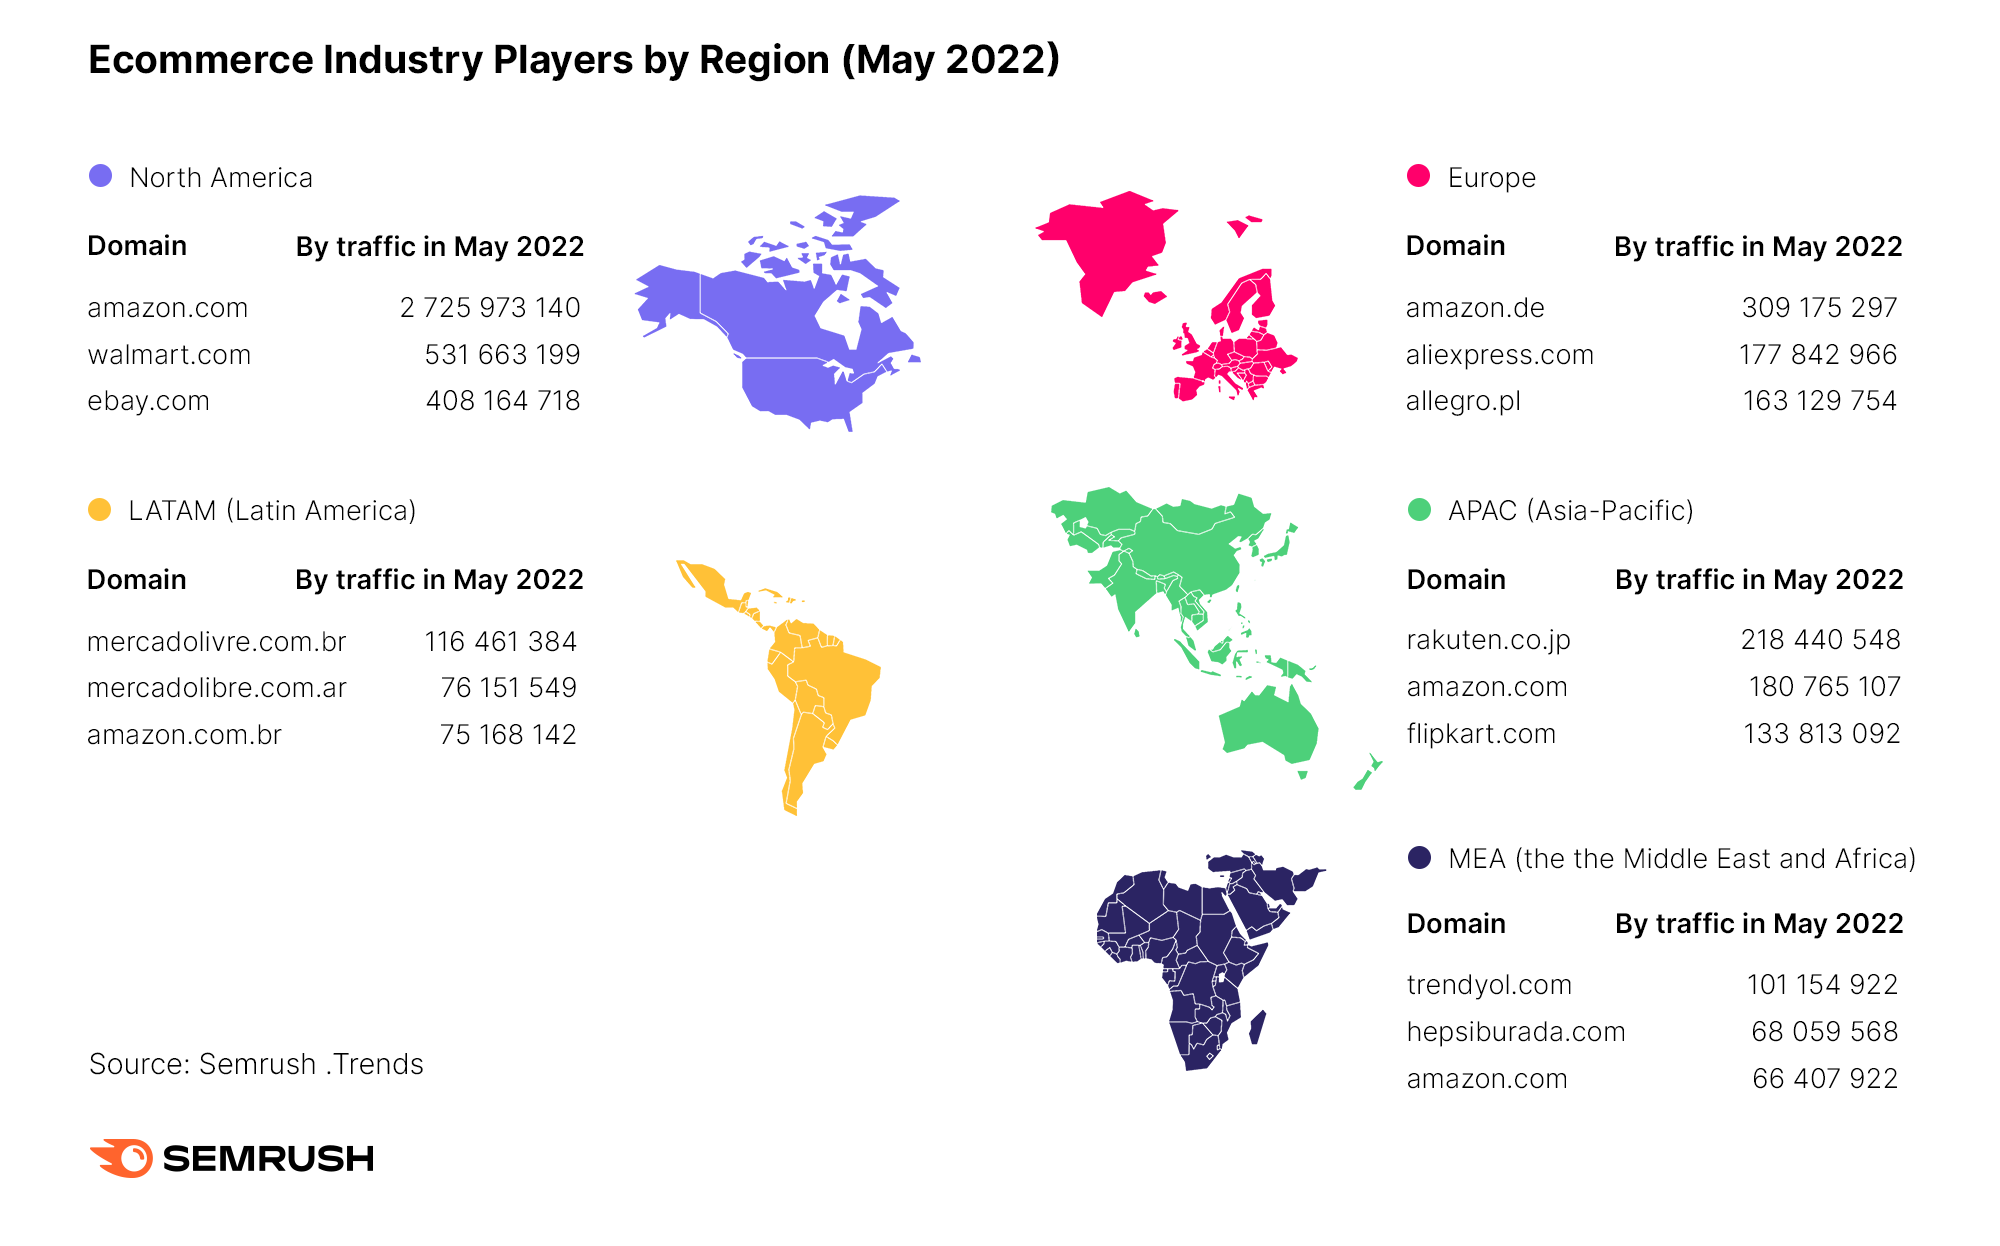
Amazon is the #1 ecommerce brand across North America and Europe. But when we look outside of the Western hemisphere——MEA (the Middle East and Africa), LATAM (Latin America), and APAC (Asia-Pacific)—the picture appears a bit different.
Amazon makes it into the top 3 across non-western regions, but other top market players are more local.
Top Traffic Sources Global vs. Europe
The overall traffic generation picture is similar to what you’d expect from an ecommerce brand—the absolute majority of traffic is direct.
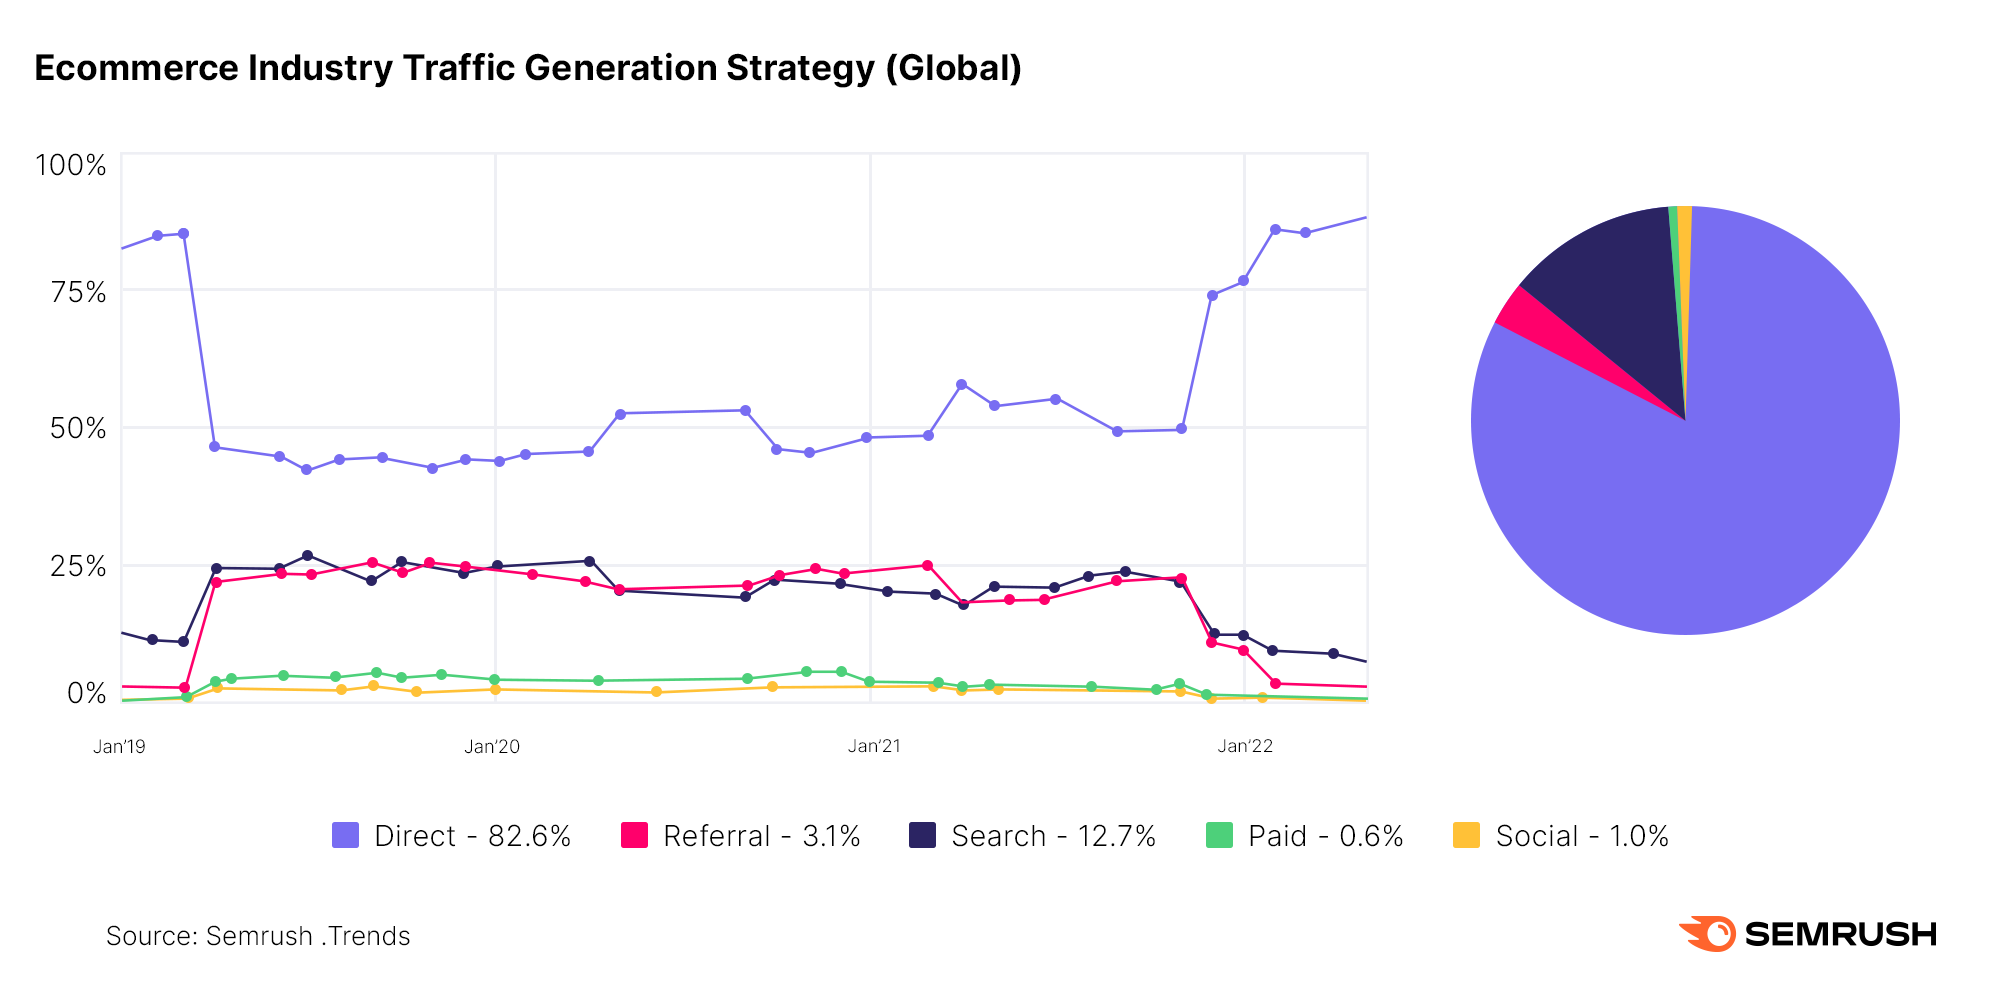
This implies that brand awareness is the most powerful tool in any ecommerce marketer’s toolbox. Direct traffic has always accounted for the largest share of traffic within the ecommerce space, and this trend only grew throughout the pandemic.
At the end of 2021, however, the surge in direct visits marked a return to pre-pandemic levels and has continued to grow ever since. As of today—direct visits make up more than 83% of all ecommerce traffic across the globe.
When considering individual regions in isolation, however, we discover some variations. Looking to Europe, for example, we uncover some distinctions compared to the global trends.
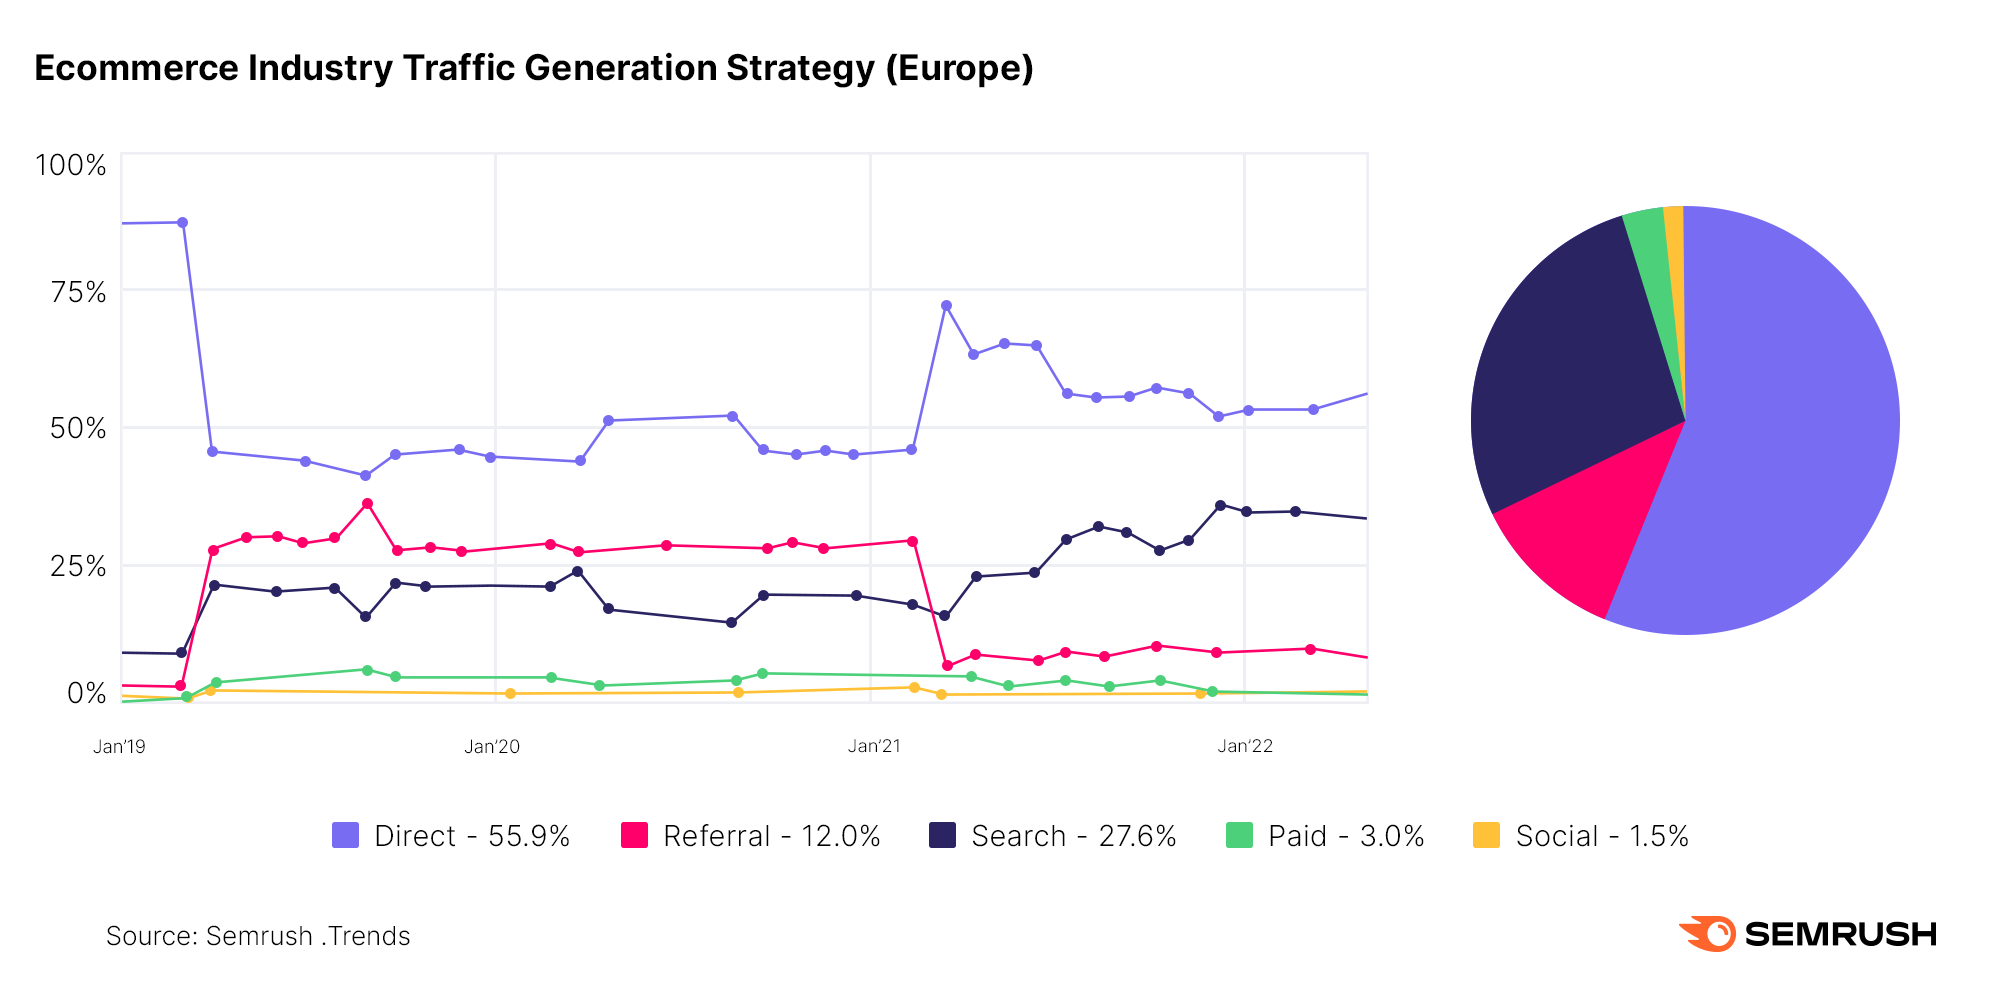
While globally, there has been a comeback of direct traffic in 2022, the European ecommerce market hasn’t seen such a steep increase. Likewise, search traffic in Europe has been on an upward trend, pointing to the importance of a strong SEO strategy.
Market Size by Location
Every market has untapped growth potential. To explore the potential of the ecommerce market, we examined audiences for the top ecommerce players in each region to figure out the growth potential.
For example, this graph compares the ecommerce markets of various countries within Latin America.
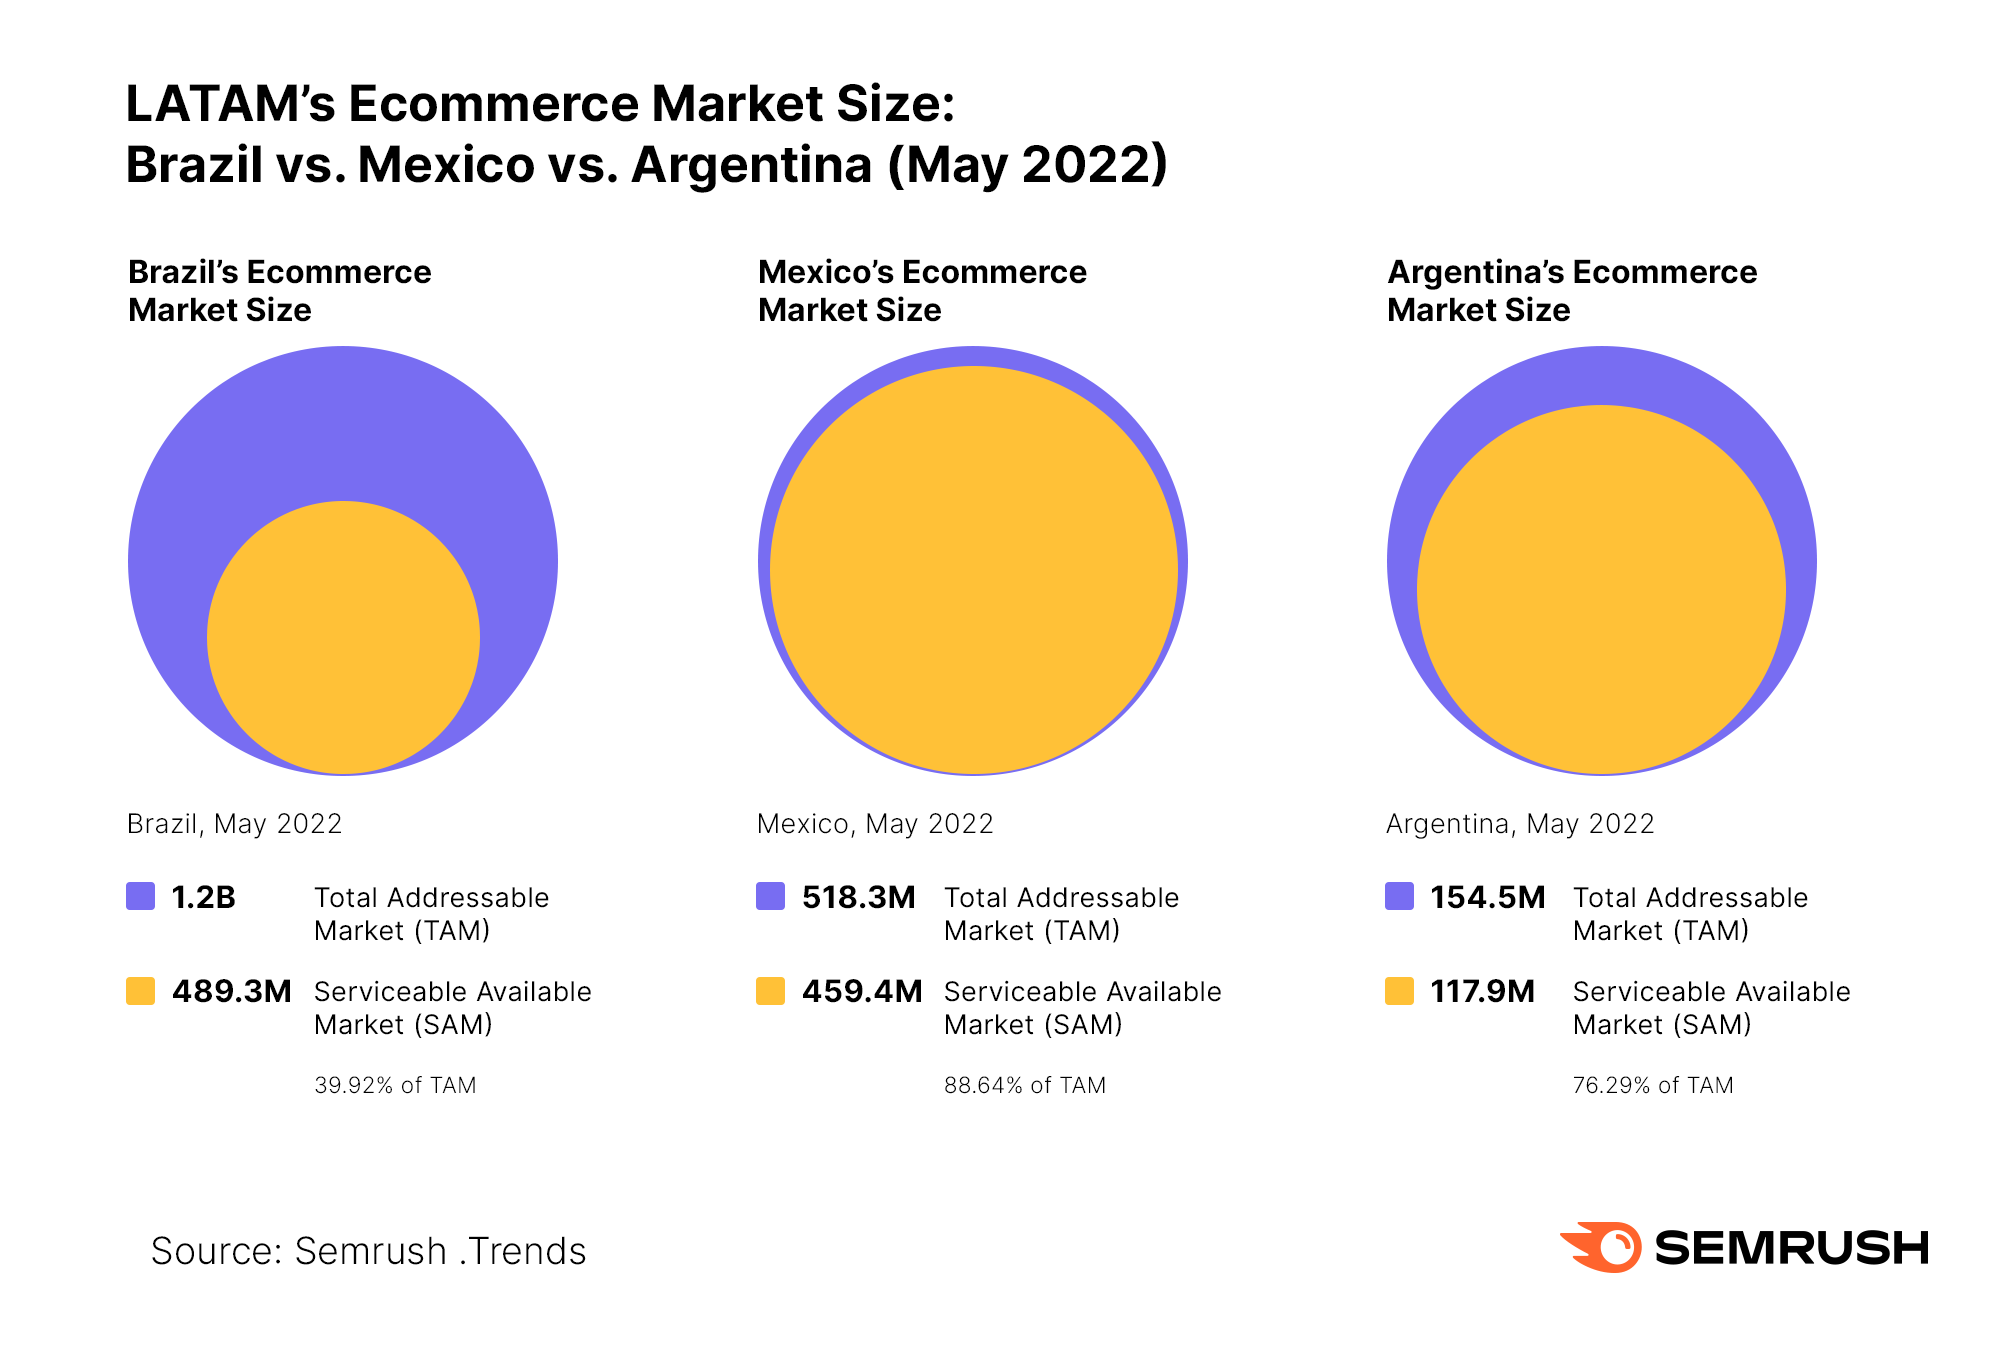
Looking at demand stats for products Latin American e-tailers offer (based on keyword volumes and traffic to these keywords) alongside data related to the size of the audience, we’re able to generate metrics for the Total Addressable Market and the Serviceable Available Market.
- Total Addressable Market (TAM) represents the amount of demand within the market, or the market’s maximum potential. Since each individual consumer can represent more than one unit of demand–for example, parents with infants buy diapers over and over again, generating multiple units of demand–this number is typically larger than the individual number of market customers.
- Serviceable Available Market (SAM) is more sales-focused and represents the share of consumers who need, want, can afford, and are ready to buy a product. It shows how many sales you could potentially see if you held a 100% market share within the ecommerce space in the US.
In LATAM’s case, the market size for ecommerce follows the usual economic logic—Brazil, the regional economic leader, has twice the market potential of Mexico (the second economic power within the region). Argentina, with its booming ecommerce market and constant inflation crisis, comes third.
What Ecommerce Products are Most Popular?
The leading question for any ecommerce business is, “What do customers want?”
From country to country, people turn to ecommerce sites for various products. But do their preferences vary depending on location?
Using Traffic Analytics, we went deep on exploring the top products across the US, Europe, and Asia. Here’s a look at top products from the APAC market.
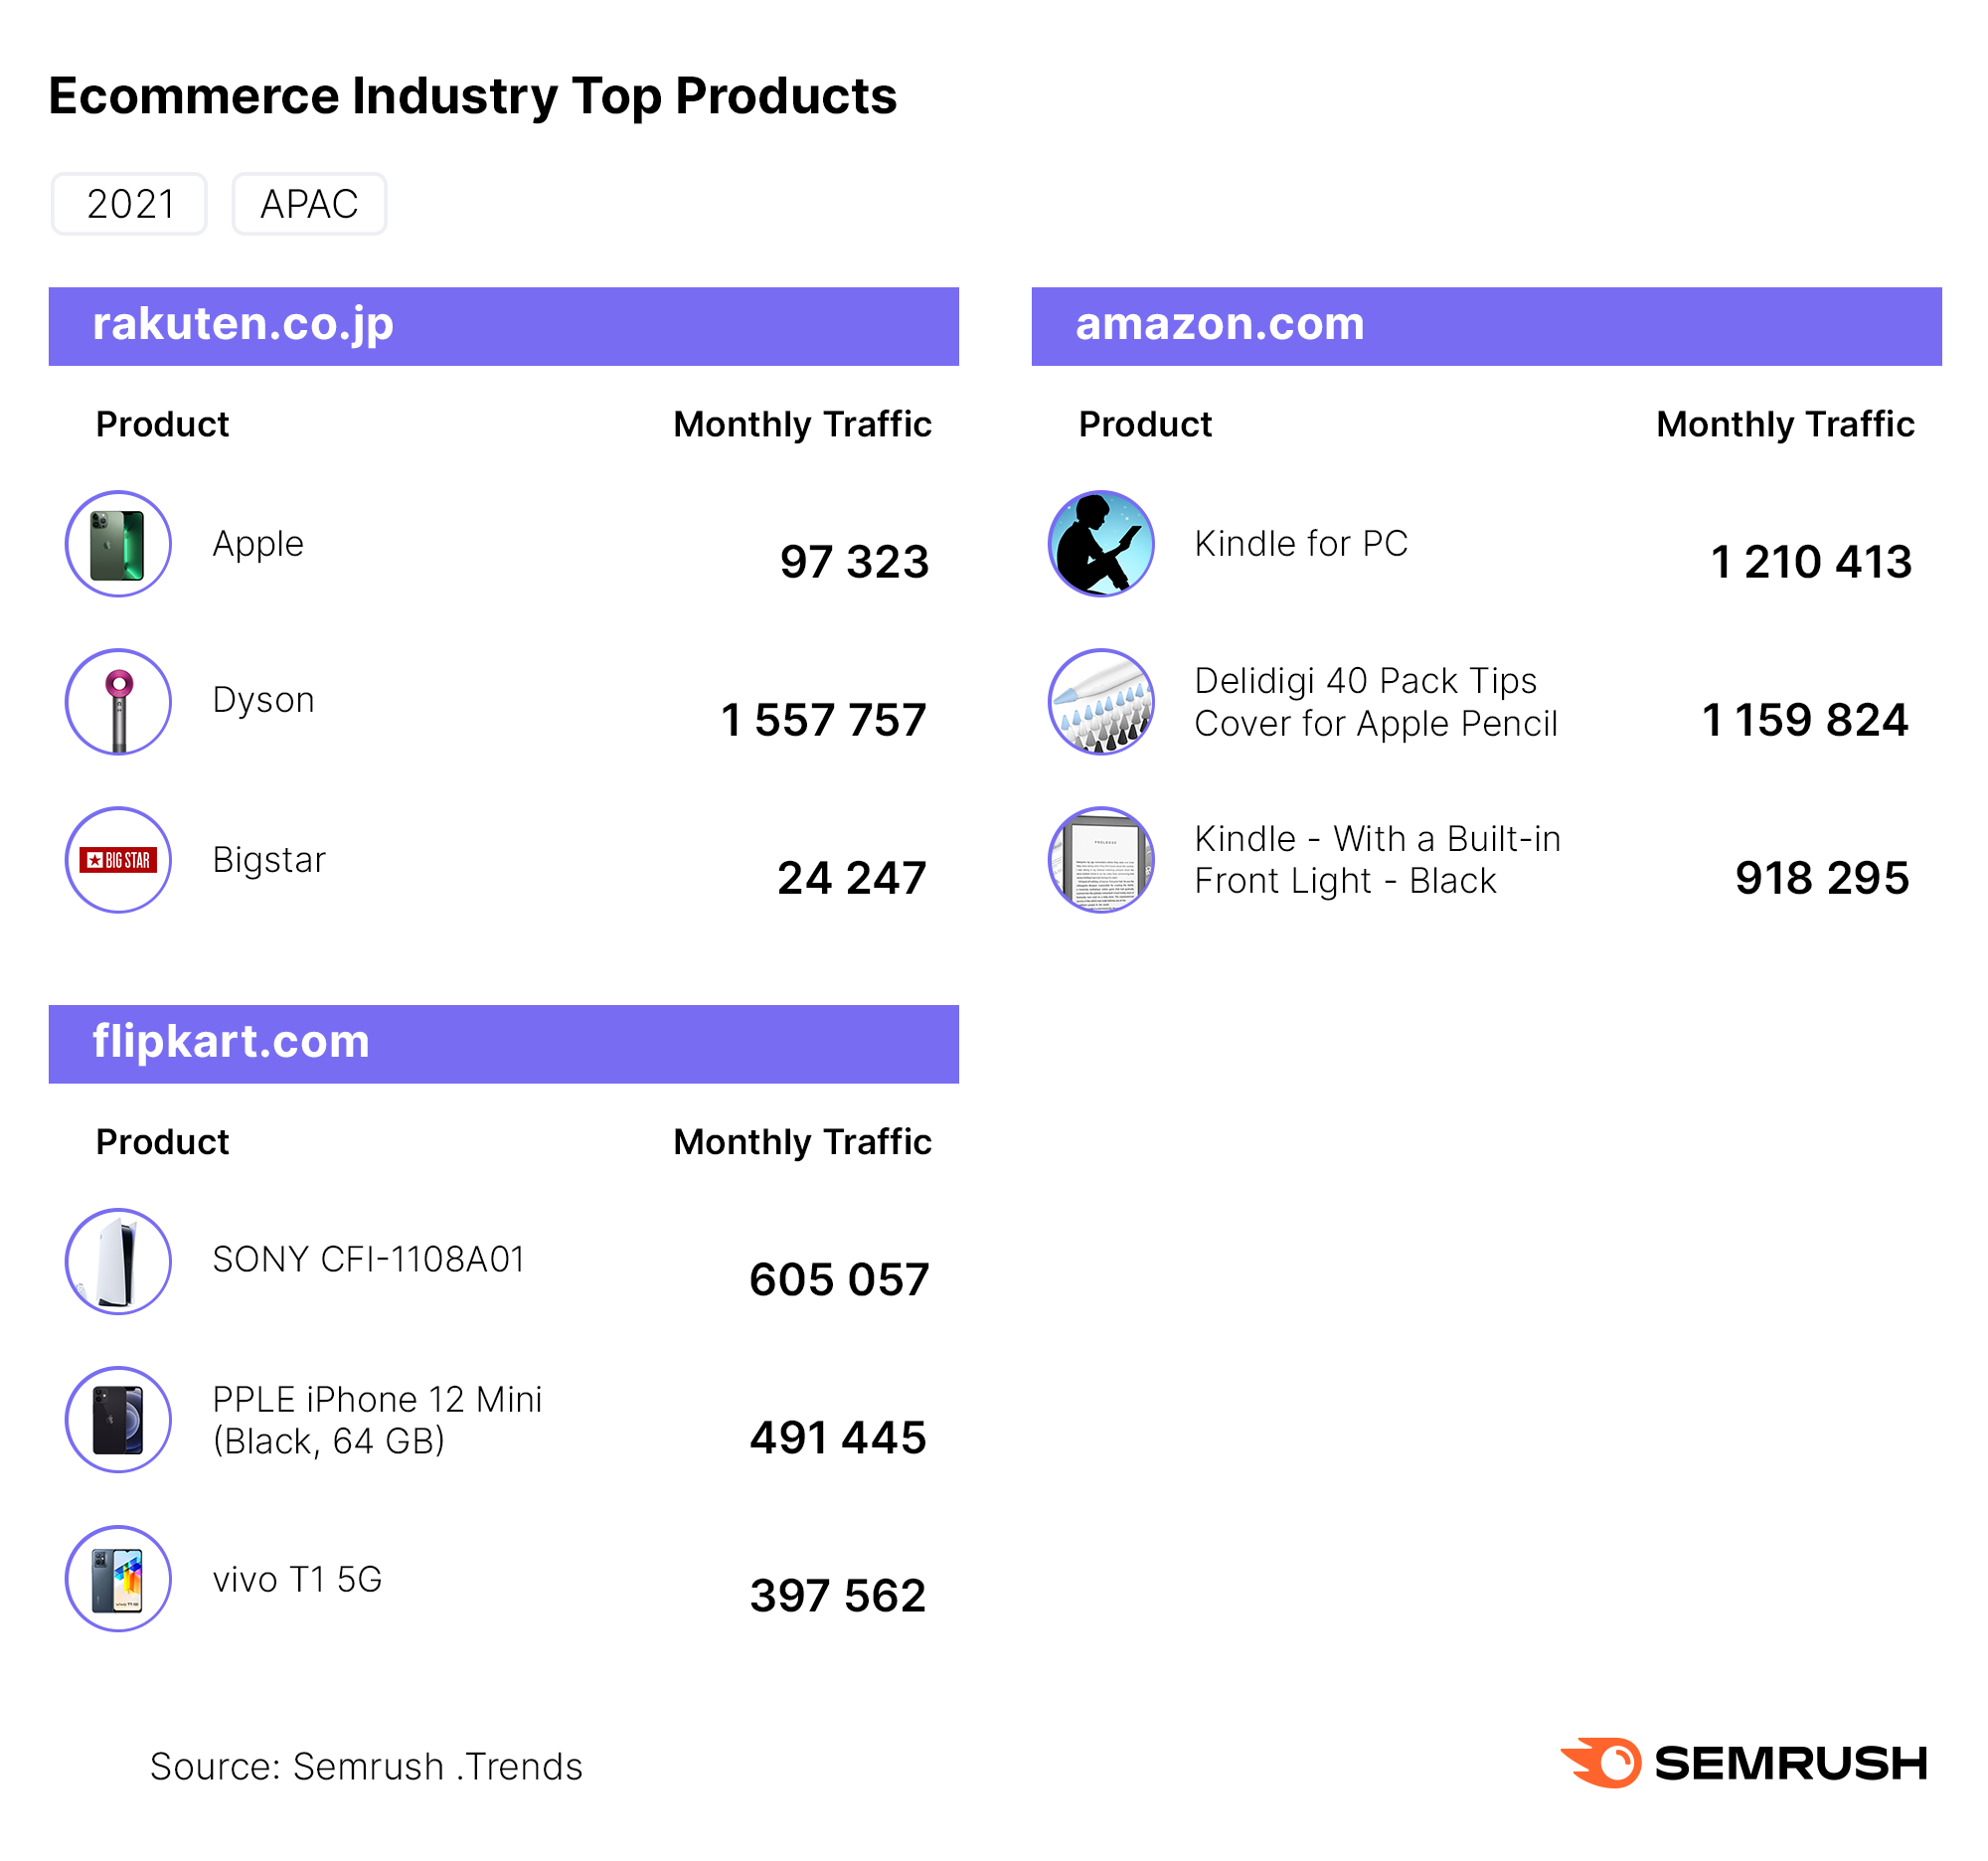
Here, tech products reign supreme. By looking at monthly traffic to each item from the various e-tailers, we can see which products are hottest in the market.
Along with the top ecommerce sites and the hottest products, we explored the most effective emotional triggers e-tailers use in their ads to get customers to click.
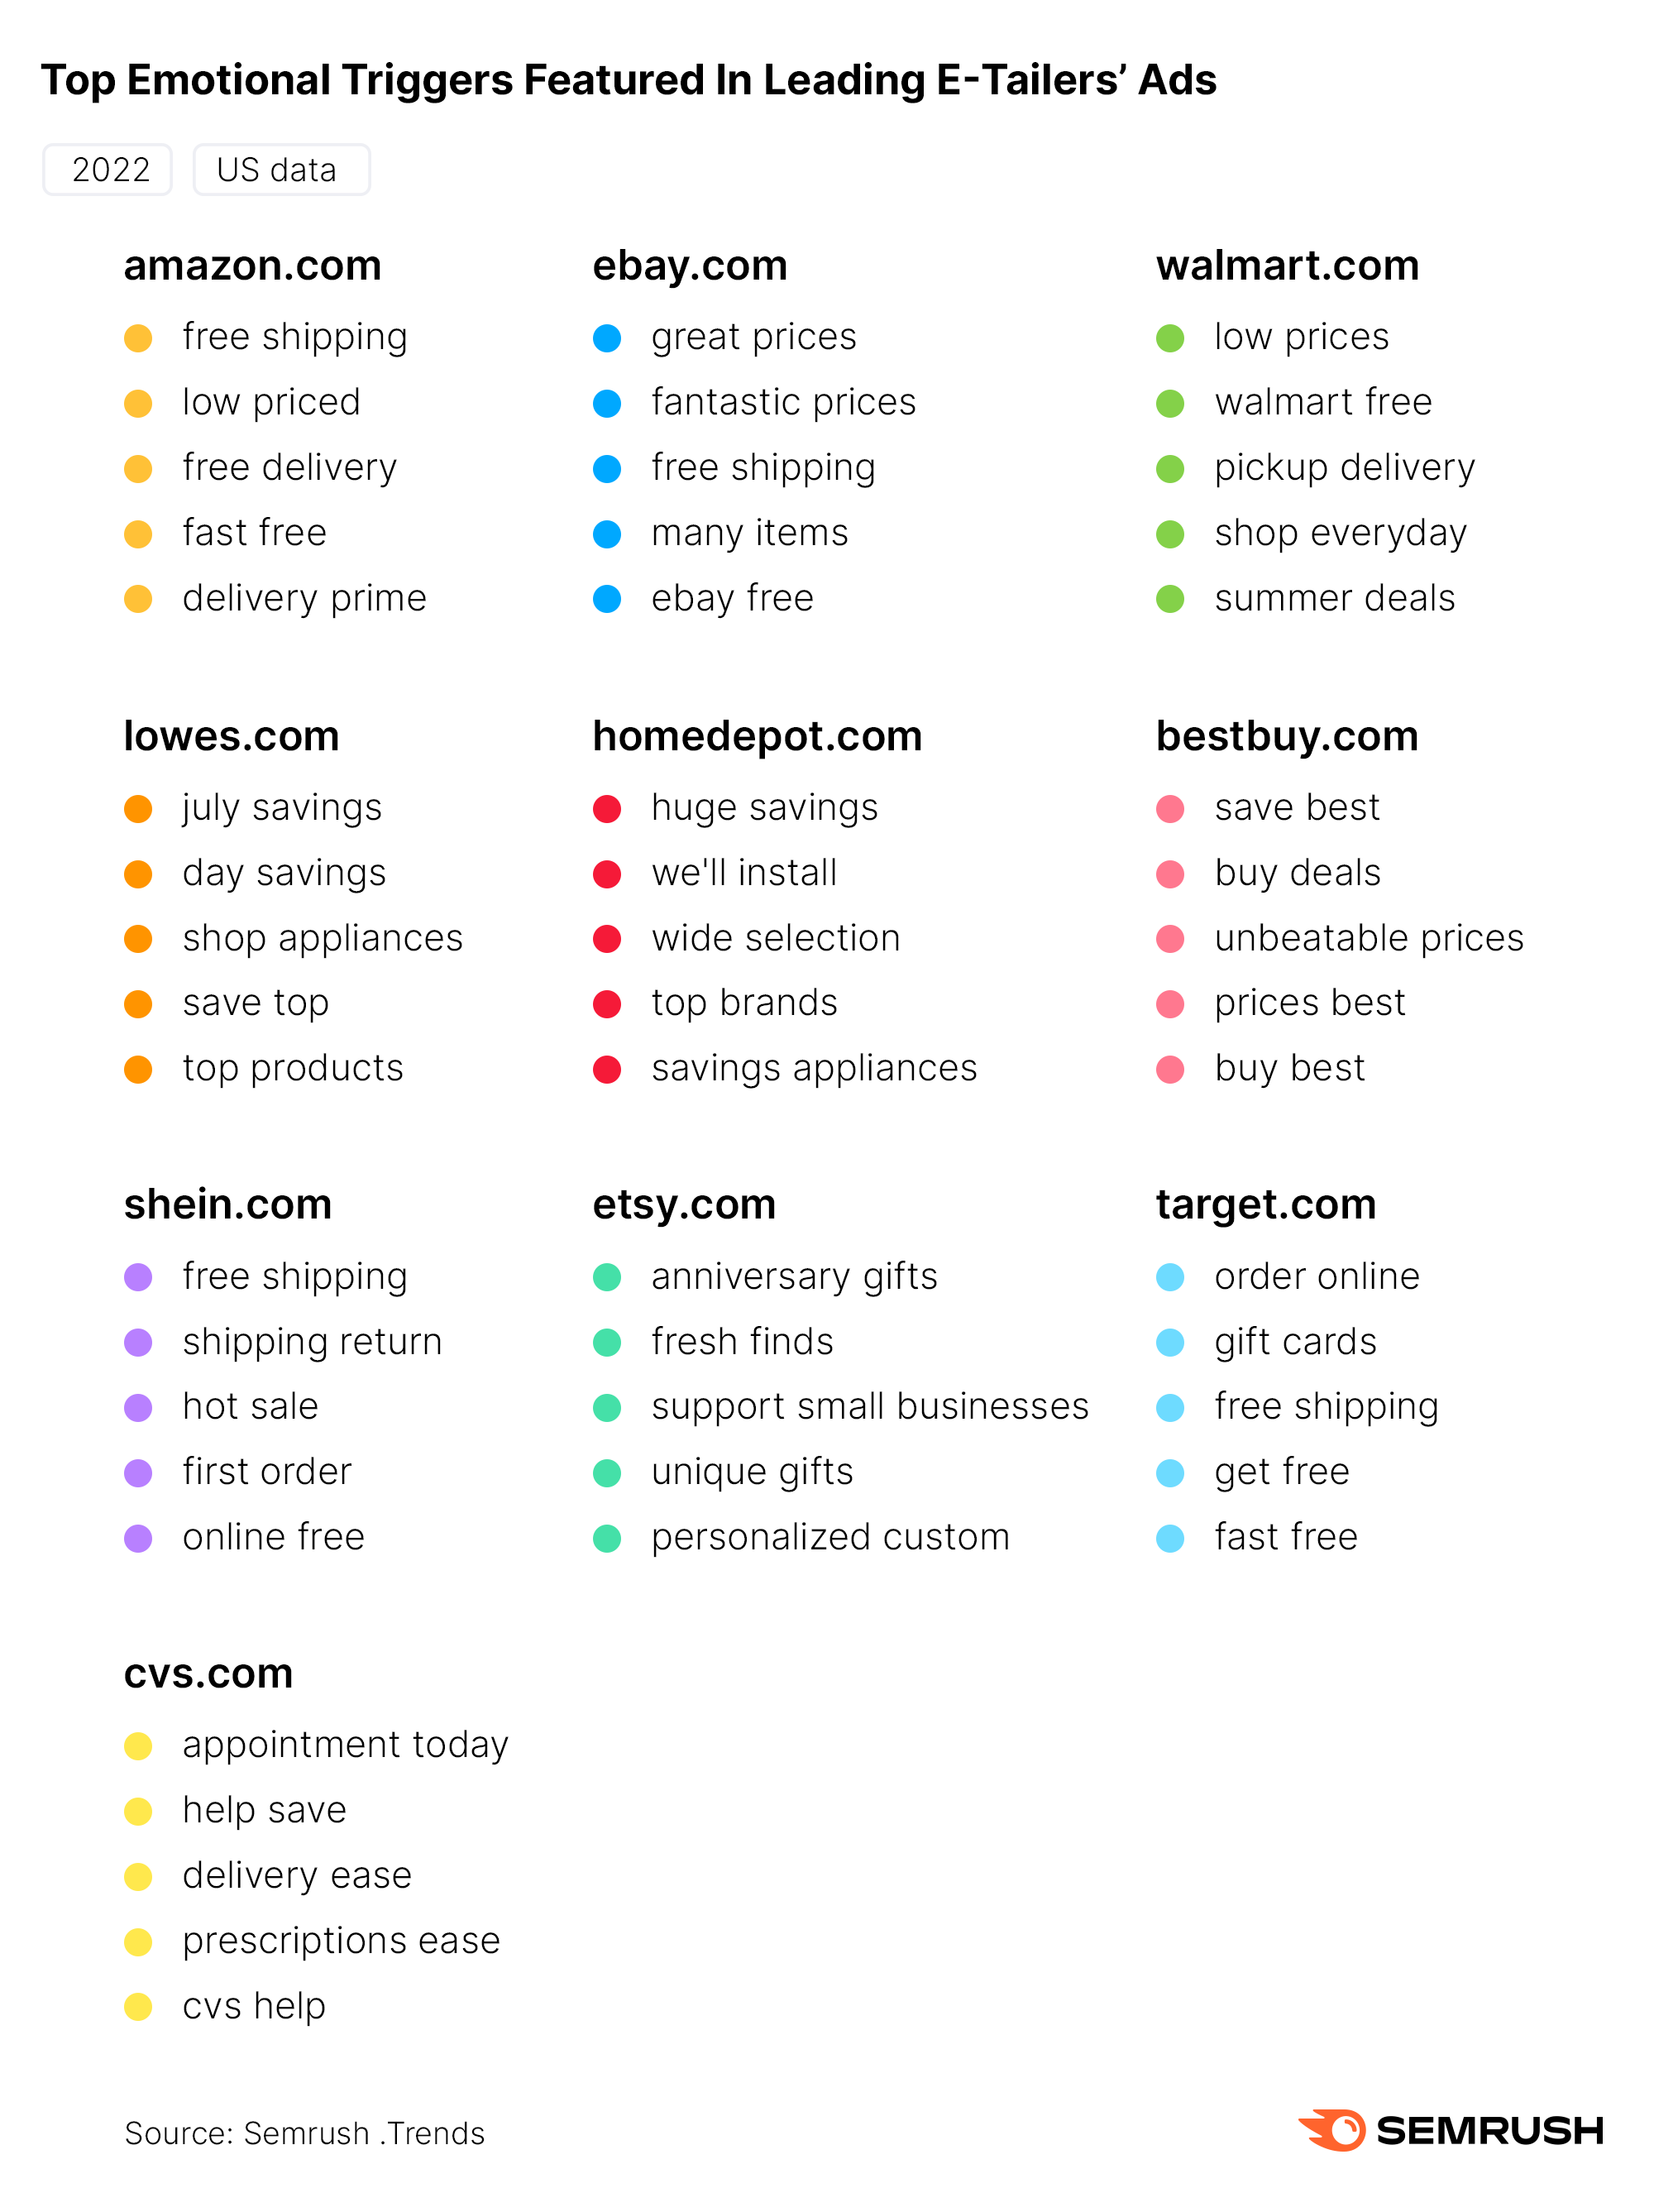
This graphic shows the emotional triggers that lead to the most conversions for top ecommerce players in the US.
3 Key Insights From Our Ecommerce Research
While Semrush Traffic Analytics can help you uncover a ton of useful insights, we wanted to offer a few based on the sampling of data we shared in this post.
- Ecommerce will continue growing, but with a slowing growth rate, depending on market growth alone won’t be enough to find success. Businesses should focus on a strong data-informed marketing strategy for growth moving into the future.
- Top players, traffic trends, and market potential show a great deal of variation by region. Getting specific about the region you're targeting and analyzing the data is key for success in today’s ecommerce landscape.
- Top products and ad strategies also vary by region. When looking to increase your impact in your home market or break into new markets, knowing what local customers want and need is crucial.
In this post, we’ve just scratched the surface of this exciting industry. And if history tells us anything, there will be plenty of exciting opportunities to come. In this rapidly changing industry, staying ahead of the curb is key for success. For more data and insights on emerging ecommerce trends, try Semrush Traffic Analytics today!
